
For investors who use technical analysis to find possible opportunities, a common plan involves locating stocks that are both technically sound and ready for a move soon. This frequently means looking for equities that are in clear uptrends but are now pausing, giving a more distinct entry point with clear risk. One way to organize this search is by using specialized ratings like those from ChartMill, which independently assess a stock's basic technical condition and the state of its present price formation. A stock that rates well on both measures can make a strong argument for a technical breakout trade.
Lately, this method of screening has pointed to CHUBB LTD (NYSE:CB) as a candidate for more review. The global insurance company displays traits that match the breakout plan, joining a sound trend with a formation hinting at a possible next advance.
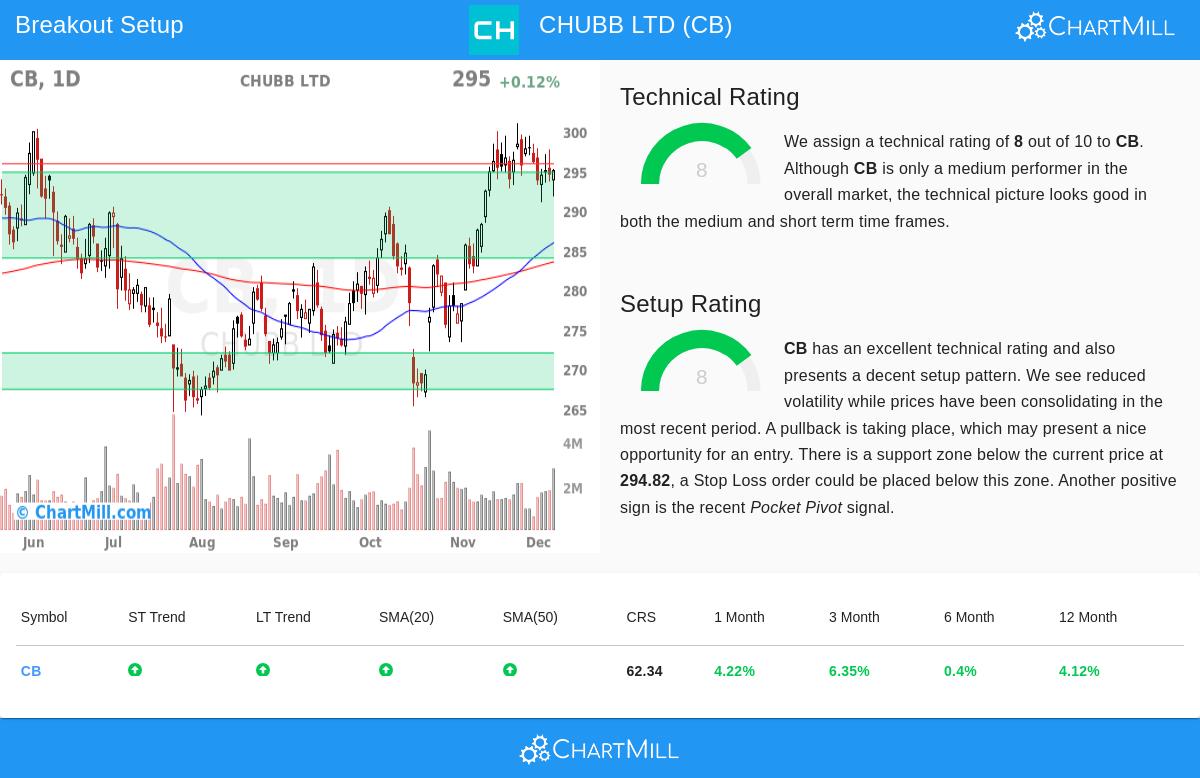
Reviewing the Technical Base
The first part of this plan is finding stocks with good basic technicals, as a high technical rating implies the stock is in a steady uptrend and is a leader in its field. CHUBB’s technical picture, shown in its full technical report, gets a firm rating of 8 out of 10. This number comes from several good points:
- Trend Agreement: Both the near-term and longer-term trends for CB are seen as up. This agreement across different periods is a main sign of health and lowers the chance of mixed messages.
- Moving Average Backing: The stock is priced above its important moving averages (20, 50, 100, and 200-day), and all these averages are climbing. This layered arrangement shows wide buying support over many timeframes.
- Relative Performance: In the active insurance field, CB does better than 77% of its 147 competitors. While its performance compared to the market over the last year is more average, its field leadership is a good technical advantage.
This mix of a clear uptrend, backing from climbing averages, and field outperformance gives the needed "technical condition" that forms the base for a possible breakout trade. A stock must first be moving up well to support an entry on a continuation signal.
Reviewing the Formation State
A sound trend by itself is insufficient; entering a stock that has just jumped can result in quick declines. The second vital rating reviews the "formation state," searching for pause patterns that provide a planned entry point with a sensible stop-loss point. CHUBB scores an 8 here too, showing a high-grade formation.
The study indicates a "bull flag" formation, where prices are dipping slightly in a controlled way after a solid earlier rise. This pause has helped lower instability and brings the price action nearer to near-term support, narrowing the risk limits for a new entry. Main parts of the formation include:
- Clear Support Area: A defined support zone is seen between about $284 and $295, made by a meeting of trendlines and moving averages. This zone gives a concrete guide for setting a protective stop-loss order.
- Lowered Instability: The recent pause has limited price movement, which often comes before a clear move in the direction of the basic trend.
- Positive Volume Sign: The report mentions a recent "Pocket Pivot" sign, a pattern where the stock rises on volume greater than the worst down-volume day in the earlier period, hinting at buying by bigger participants.
Based on this formation study, the report proposes a possible trading plan with an entry just above the present pause near $295.91 and a stop-loss just below the recent low around $291.02. This plan seeks to join if the breakout above the pause happens while firmly capping downside risk if the move does not succeed.
A Candidate for Technical Breakout Watchlists
CHUBB LTD presents an example that suits the technical breakout screening process. It has the two marks of a high technical rating, confirming its place in a wider uptrend, and a high formation rating, showing it is in a constructive pattern that may come before its next rise. For technical investors, this combination of factors makes CB a stock to watch for a possible breakout from its present pause, with plainly set points for entry and risk control.
This review of CHUBB was found through a systematic screen for stocks showing both sound technicals and high-grade formations. Investors searching for similar chances can find new results each day by visiting the Technical Breakout Setups screen.
Disclaimer: This article is for information only and is not investment advice, a suggestion, or an offer to buy or sell any security. The trade formation mentioned is an automatically created example to illustrate and is not a prompt to make a trade. All investing and trading has risk, including the possible loss of principal. Always do your own research, think about your financial position and risk comfort, and talk with a qualified financial advisor before any investment choices. Past results do not guarantee future outcomes.