
For investors looking to find possible trading chances, technical analysis offers a method for judging stocks using price movement and market activity. One organized method uses filters to find stocks showing both good technical condition and price patterns that might come before notable price changes. This process joins ChartMill's own Technical Rating, which reviews a stock's general trend condition, with the Setup Quality Rating, which finds times of price stability that frequently result in breakout chances. Stocks with good scores in both groups are interesting options for technical investors searching for positions in confirmed upward trends.
Cadence Bank (NYSE:CADE) has appeared as a significant option from this filtering process, offering wide banking and financial services in the Southern United States. The company's technical picture indicates it could be set for possible upward price action judging by present chart formations and momentum signals.
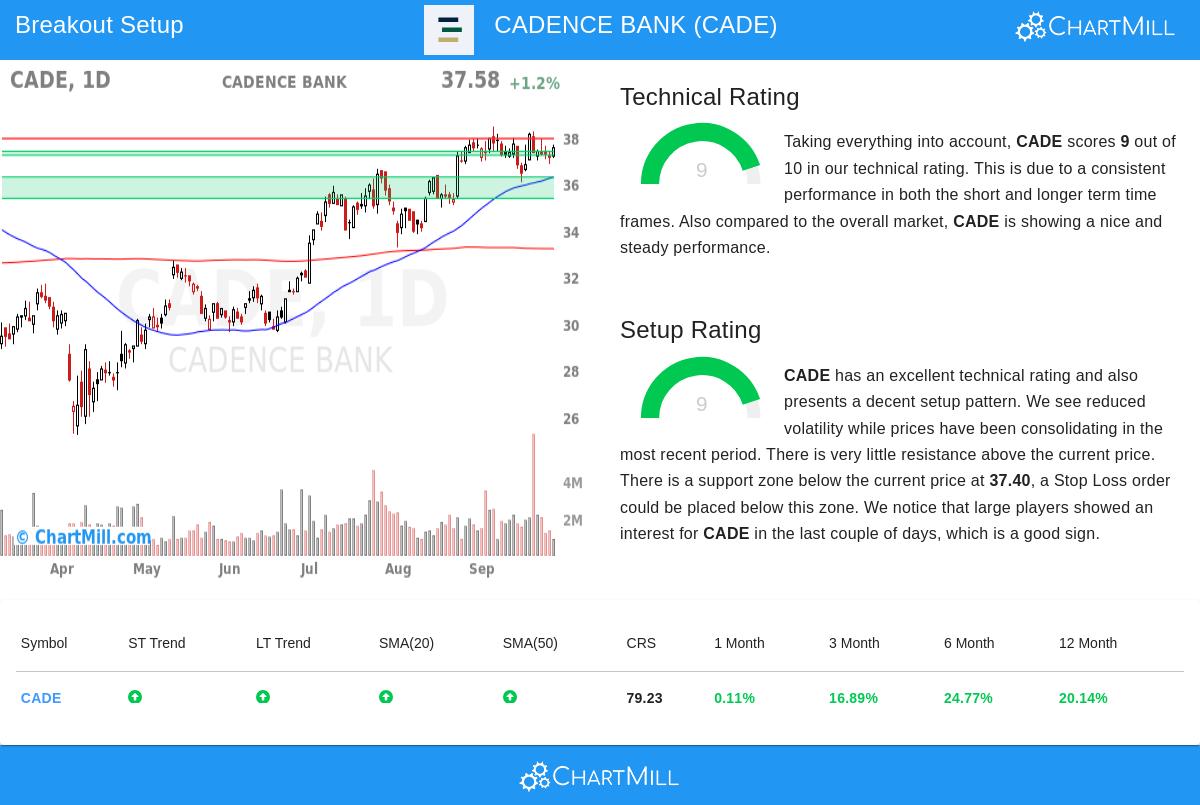
Technical Condition Review
Cadence Bank shows very good technical condition, receiving a Technical Rating of 9 out of 10 in the detailed technical analysis report. This good rating shows several favorable elements that match the filtering method's focus on finding stocks with confirmed upward momentum:
- Both near-term and longer-term trends are clearly positive, showing steady buying interest across various time periods
- The stock does better than 79% of all stocks in yearly results and holds a similar position inside the banking sector
- Price stays above important moving averages (20-day SMA: $37.40, 50-day SMA: $36.30, 100-day SMA: $34.07)
- Relative strength measurement of 79.23 shows good performance compared to the wider market
These technical features meet the filter need for a Technical Rating of at least 7, making sure the stock keeps a verified upward trend before review for breakout possibility. The mix of good relative results, positive trend agreement, and position above several moving averages forms a base for continued upward price action.
Setup Condition and Stability Formation
Besides good technicals, Cadence Bank displays a very good setup arrangement with a Setup Rating of 9, showing the stock has been exchanging in a stability formation that might come before a notable price change. The setup condition measurement is important for finding good entry spots, as it helps prevent buying into overstretched moves and instead centers on periods where risk can be clearly outlined.
Recent trading shows Cadence Bank stabilizing inside the $36.08 to $38.47 band during the last month, with present prices located in the center of this band. This stability has lowered price swings and made a specific support area between $37.23 and $37.40, created by a mix of trend lines and moving averages. The nearness to resistance at $37.95 makes a clear point where a breakout could be verified.
Other favorable elements contain:
- Lowered price swings through the stability period
- Very few resistance levels above the present price point
- Significant institutional activity seen in volume review
- ATR of 0.76 gives background for trade size and stop location
Trading Points
The technical review indicates a possible trading situation with an entry above $37.96, which would show a breakout above the present resistance point. A stop loss below the support area at $37.22 would restrict loss risk to about 1.95% on the trade. The fairly close stop range shows the well-outlined nature of the present stability formation.
For investors using this plan, the mix of good technicals and high-grade setup makes Cadence Bank worth review, although as with any technical formation, correct risk control stays important. The existence of several support levels below the present price gives extra assurance that losses could be limited if the breakout happens.
For investors wanting to find related technical breakout chances, other options can be located using the Technical Breakout Setups screen, which often updates with stocks showing both good technical ratings and stability formations.
Disclaimer: This review is based on technical signals and chart formations and should not be seen as investment guidance. All trading and investment choices include risk, and people should do their own study and talk with financial experts before making investment choices. Past results do not ensure future outcomes.
