
A screening method that joins basic company strength with price momentum can help find stocks set for possible price gains. The "Strong Growth Stocks with Good Technical Setup Ratings" screen specifically looks for companies showing solid expansion in earnings and revenue, along with good financial condition and profitability. These basic qualities are then viewed through a price movement filter to find stocks displaying consolidation patterns that might come before a price surge, providing a possible point of entry for investors looking for growth chances.
Fundamental Growth Evaluation
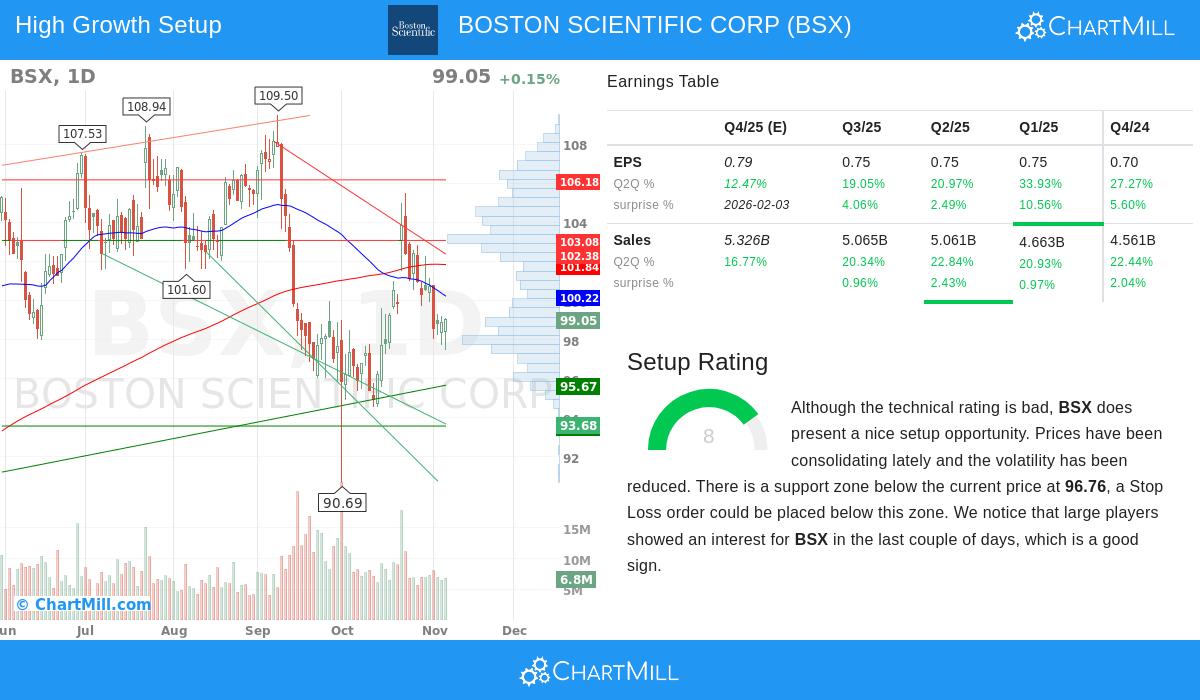
BOSTON SCIENTIFIC CORP (NYSE:BSX) displays interesting growth traits that match the screening requirements. The company's basic growth rating of 8/10 shows good historical results and positive future outlook. The medical device maker has shown notable expansion in important measures:
- Earnings Per Share growth of 25.00% over the last year
- Revenue increase of 21.62% in the most recent year
- Anticipated future EPS growth of 14.40% per year
- Forecasted revenue growth of 12.12% going forward
These growth numbers are especially important because they display a speed-up from past trends, signaling the company is building strength in its market standing. For growth investors, this pattern of acceleration frequently points to a company performing its business plan well and taking market share. The steady growth in both earnings and revenue streams indicates lasting expansion instead of short-term gains.
Profitability and Financial Condition
The company's profitability rating of 7/10 adds to its growth narrative with firm operational results. Boston Scientific keeps good margins that do better than most industry peers:
- Operating Margin of 18.69% is higher than 89.95% of industry rivals
- Return on Equity of 11.17% puts it in the leading group of its sector
- Gross Margin of 68.30% shows good pricing ability and cost management
While the financial condition rating of 5/10 indicates some points to watch, the company maintains acceptable solvency with an Altman-Z score of 5.51, showing low failure risk. The debt-to-free-cash-flow ratio of 3.33 implies the company could settle its debt responsibilities in a sensible period. These profitability and condition measures provide the base that backs lasting growth, as companies with good operational effectiveness can more easily fund future expansion without too much dependence on outside money.
Technical Setup and Market Standing
The price movement view shows an engaging setup even with the overall technical rating of 2/10. The setup rating of 8/10 signals the stock is creating a possible surge pattern after recent consolidation. Now trading between $94.53 and $105.49, the stock has been moving within a range over the last month, with prices now settling in the middle of this range. This consolidation stage frequently comes before notable price changes.
Important technical notes include:
- Support formed between $93.58 and $96.76 from multiple timeframe trendlines
- Resistance levels seen at $99.47-$100.49 and $102.38-$103.08
- Lowered volatility during the consolidation time
- Recent attention from big players as measured by the Effective Volume indicator
The stock's relative strength of 59.59% shows it has done better than most stocks in the market over the past year, though it is currently behind the wider S&P 500 index. The meeting of support levels and lowered volatility creates a situation where a surge above resistance could indicate the next upward move.
Valuation Points
Boston Scientific's valuation shows a varied view that growth investors often see. The company trades at a P/E ratio of 33.58, which seems high next to the S&P 500 average of 25.67. However, inside the healthcare equipment sector where the industry average P/E is 34.76, the valuation seems more acceptable. The forward P/E of 28.79 looks good next to both industry and market averages.
The PEG ratio, which considers growth expectations, implies the current valuation could be acceptable given the company's growth path. This situation is typical for growth stocks where investors are ready to pay higher valuations for companies showing good and speeding up expansion.
View the detailed fundamental analysis report | Review the complete technical analysis
The mix of basic growth strength with a technical setup hinting at possible momentum makes Boston Scientific a noteworthy candidate for investors using this strategy. The company's place in the healthcare equipment sector gives exposure to population trends supporting long-term growth, while its specific product group in interventional medical procedures deals with ongoing medical advances.
For investors wanting to find similar chances, more stocks meeting these requirements can be located using our Strong Growth Stocks with Good Technical Setup Ratings screen. This screening method keeps finding companies showing both basic growth features and price movement patterns that might come before important price changes.
Disclaimer: This analysis is for informational purposes only and does not constitute investment advice, recommendation, or endorsement of any security or strategy. Investors should conduct their own research and consult with financial advisors before making investment decisions. Past performance does not guarantee future results.