
Investors looking to balance the search for growth with a degree of caution often consider strategies like Growth at a Reasonable Price (GARP). This method tries to find companies showing strong and sustainable expansion paths, but whose shares are not valued at extreme highs. It is a middle path, sidestepping the speculative excitement that can accompany high-growth stocks while also avoiding deep-value situations that may not have forward progress. One methodical way to apply this strategy is by using fundamental stock screeners that rate companies on important financial measures. An "Affordable Growth" screen, for example, could select for stocks showing solid expansion, good core earnings, acceptable financial condition, and a price that does not seem too high.
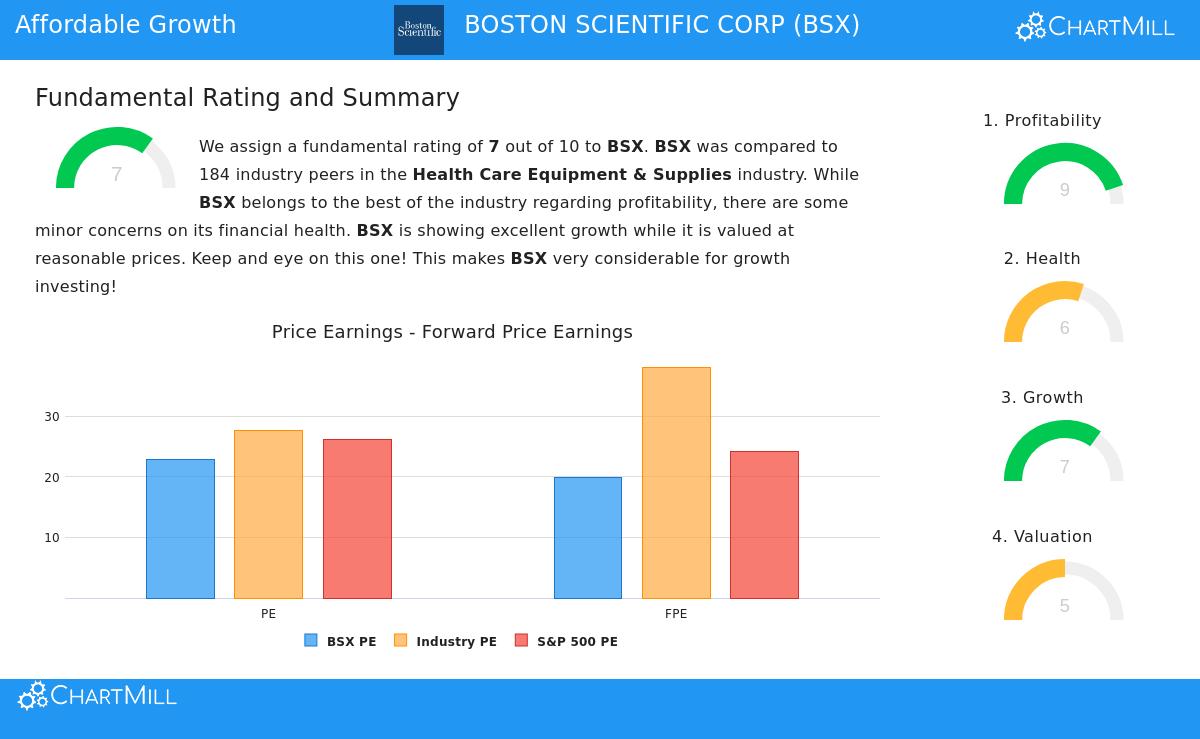
BOSTON SCIENTIFIC CORP (NYSE:BSX) appears as a candidate from such a screening process. The medical device leader, recognized for its work in interventional cardiology, endoscopy, urology, and neuromodulation, shows a financial picture that matches the main ideas of affordable growth investing. Its fundamental analysis report, which can be examined in detail here, gives a measured summary of its positives and possible issues.
Growth Path: A Main Positive
The growth measure is key to the GARP strategy, and Boston Scientific rates well here with a score of 7. The company is not only expanding, it is producing notable gains in important figures. This steady top and bottom-line expansion points to a company effectively bringing its products to market and increasing its market presence, a necessary element for maintaining investor gains without depending only on a higher valuation.
- Revenue Growth: The company reported a 19.88% rise in revenue over the past year, with a good five-year average annual growth rate of 15.16%. Projections indicate continued solid expansion of over 10% each year.
- Earnings Per Share (EPS) Growth: Profit expansion is even more marked, with EPS rising 21.51% in the last year and averaging a high 26.01% growth over recent years. While future EPS growth is projected to slow to a still-acceptable 13.13%, it stays firmly positive.
Valuation: Fair Given the Situation
A fair price is the "affordable" part of the idea, serving as a buffer. Boston Scientific's valuation score of 5 shows it is not low in absolute terms, but the situation is important. The score reflects a varied view where some figures seem high while others look fair compared to similar companies and expansion outlook.
- P/E Ratios: With a trailing P/E of 22.83 and a forward P/E of 19.91, the stock trades approximately in line with the wider S&P 500. However, compared to its own industry in Health Care Equipment & Supplies, where average prices are higher, Boston Scientific is valued lower than over 75% of its peers.
- Growth-Considered Figures: The PEG ratio, which includes earnings expansion, implies the current price may be a fair exchange for the projected growth rate. Also, price figures based on cash flow and EBITDA look more attractive, showing the stock is priced lower than a large majority of industry rivals on these bases.
Profitability and Financial Condition: The Supporting Base
For expansion to be lasting and worthwhile, it must be supported by effective operations and a steady balance sheet. This is where profitability and financial condition scores confirm the growth narrative. Boston Scientific does very well in profitability with a high score of 9, indicating its capacity to turn revenue into profits.
- High Margins and Returns: The company has good profit (14.44%) and operating margins (19.92%), doing better than over 90% of its industry. Its returns on assets, equity, and invested capital are all very good, showing highly effective use of money.
- Financial Condition Points: The condition score of 6 is the more average part of the profile. The company shows acceptable overall stability with a good Altman-Z score and a workable amount of debt. The main points for attention relate to liquidity ratios (Current and Quick Ratio), which are lower than many peers. However, the analysis states that given the company's good profitability and stability, these ratios may not signal immediate liquidity problems but are items for investors to watch.
Conclusion and Additional Study
Boston Scientific Corp presents a strong case for investors using an affordable growth strategy. The company shows notable, double-digit expansion in both revenue and earnings, the necessary driver for GARP investing. This expansion is backed by top-level profitability figures, suggesting it is good-quality growth. While the stock's P/E ratio is not low on its own, it seems fair when compared to its own growth rate, its industry, and the wider market. The acceptable stability figures provide a base, though the liquidity situation deserves notice.
The analysis proposes that BSX’s mix of solid expansion, very good profitability, and a fair price makes it a notable candidate for a growth-focused portfolio that also considers cost. This fits with the screening idea that looks for companies where you are not paying too much for future possibility.
For investors wanting to review other companies that match this "Affordable Growth" profile, you can use the same screen via this link to the ChartMill stock screener.
Disclaimer: This article is for informational purposes only and does not constitute financial advice, a recommendation, or an offer or solicitation to buy or sell any securities. The analysis is based on data and ratings provided by third-party sources. Investors should conduct their own independent research and consult with a qualified financial advisor before making any investment decisions. Past performance is not indicative of future results.