
Our stock screener has flagged BOSTON SCIENTIFIC CORP (NYSE:BSX) as a potential breakout candidate. This occurs when the stock shows signs of consolidation after a notable upward trend. While we can't predict the actual breakout, it's worth monitoring NYSE:BSX for potential movement.
In-Depth Technical Analysis of BSX
ChartMill assigns a Technical Rating to every stock. This score ranges from 0 to 10 and is updated daily. The score is determined by evaluating multiple technical indicators and properties.
Taking everything into account, BSX scores 10 out of 10 in our technical rating. This is due to a consistent performance in both the short and longer term time frames. Also compared to the overall market, BSX is showing a nice and steady performance.
- Both the short term and long term trends are positive. This is a very positive sign.
- Looking at the yearly performance, BSX did better than 90% of all other stocks. We also observe that the gains produced by BSX over the past year are nicely spread over this period.
- BSX is one of the better performing stocks in the Health Care Equipment & Supplies industry, it outperforms 89% of 189 stocks in the same industry.
- BSX is currently trading near its 52 week high. This is a good sign, certainly because the S&P500 Index is not trading near new highs.
- BSX is currently showing a bull flag pattern! A bull flag pattern occurs when prices pull back slightly after a strong rise up. This may be a nice opportunity for an entry.
Check the latest full technical report of BSX for a complete technical analysis.
How do we evaluate the setup for BSX?
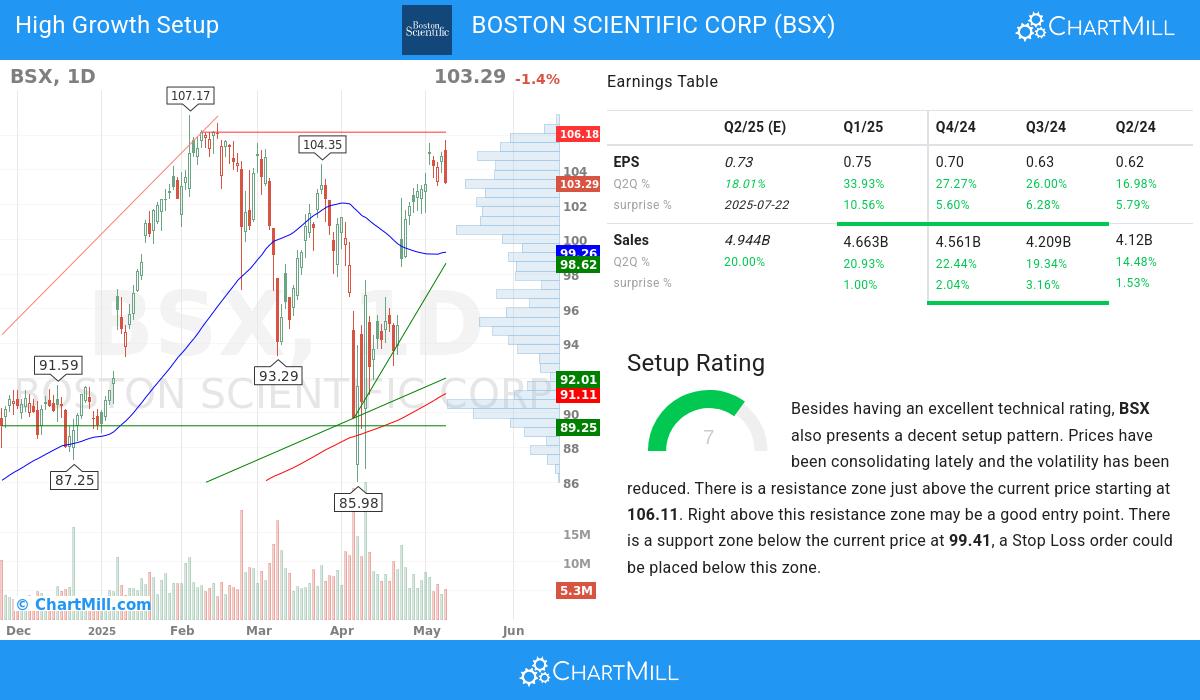
In addition to the Technical Rating, ChartMill provides a Setup Rating for each stock. This rating, ranging from 0 to 10, assesses the level of consolidation in the stock based on multiple short-term technical indicators. Currently, BSX has a 7 as its setup rating, indicating its current consolidation status.
BSX has an excellent technical rating and also presents a decent setup pattern. We see reduced volatility while prices have been consolidating in the most recent period. There is a resistance zone just above the current price starting at 106.11. Right above this resistance zone may be a good entry point. There is a support zone below the current price at 99.41, a Stop Loss order could be placed below this zone.
What matters for high growth investors.
ChartMill assigns a proprietary High Growth Momentum Rating (HGM) to each stock. The score is computed by evaluating various growth and profitability aspects aspects, like EPS and revenue growth, accelleration, surprises and revisions. BSX was assigned a score of 6 for growth:
Explosive Earnings Growth
- The recent financial report of BSX demonstrates a 33.93% increase in quarterly earnings compared to the previous quarter. This growth indicates positive momentum in the company's financials and suggests a promising upward trend
- Accelerating EPS growth for BSX: the current Q2Q growth of 33.93% exceeds the previous quarter Q2Q growth of 27.27%.
- EPS growth accelerated for 3 quarters in a row.
- BSX has achieved 26.17% growth in EPS over the past 12 months, reflecting a sustained improvement in earnings performance.
- BSX has demonstrated strong quarter-to-quarter (Q2Q) revenue growth of 20.93%, reflecting its ability to generate consistent increases in sales. This growth highlights the company's effective market positioning and its potential for continued success.
- The average next Quarter EPS Estimate for BSX has experienced a 4.24% change in the last 3 months, reflecting evolving expectations by analysts regarding the company's EPS performance.
- BSX has consistently exceeded EPS estimates in the last 4 quarters, demonstrating its ability to outperform market expectations. This trend highlights the company's strong financial performance and its potential for future growth.
Profitability & Financial Strength
- With a favorable trend in its operating margin over the past year, BSX demonstrates its ability to enhance profitability through efficient operations. This growth reflects the company's focus on optimizing its cost structure.
- BSX has experienced growth in its profit margin over the past year, reflecting improved operational performance.
- With a favorable trend in its free cash flow (FCF) over the past year, BSX demonstrates its ability to generate robust cash flows and maintain financial stability. This growth reflects the company's focus on efficient capital allocation and cash management.
- With a current Debt-to-Equity ratio at 0.41, BSX showcases its disciplined capital structure. The company's prudent management of debt obligations contributes to its financial stability and long-term sustainability.
Market Strength & Institutional Confidence
- The ownership composition of BSX reflects a balanced investor ecosystem, with institutional shareholders owning 93.1%. This indicates a broader market participation and potential for increased trading liquidity.
- BSX has exhibited strong Relative Strength(RS) in recent periods, with a current 90.41 rating. This indicates the stock's ability to outperform the broader market and reflects its competitive position.
More ideas for high growth momentum breakouts can be found on ChartMill in our High Growth Momentum Breakout screen.
Disclaimer
This is not investing advice! The article highlights some of the observations at the time of writing, but you should always make your own analysis and invest based on your own insights.