
Growth investors are looking for stocks showing high revenue and EPS growth. We will have a look here to see if BOSTON SCIENTIFIC CORP (NYSE:BSX) is suited for growth investing. Investors should of course do their own research, but we spotted BOSTON SCIENTIFIC CORP showing up in our Minervini growth screen, so it may be worth spending some more time on it.
A Technical Analysis using the Minervini Trend Template.
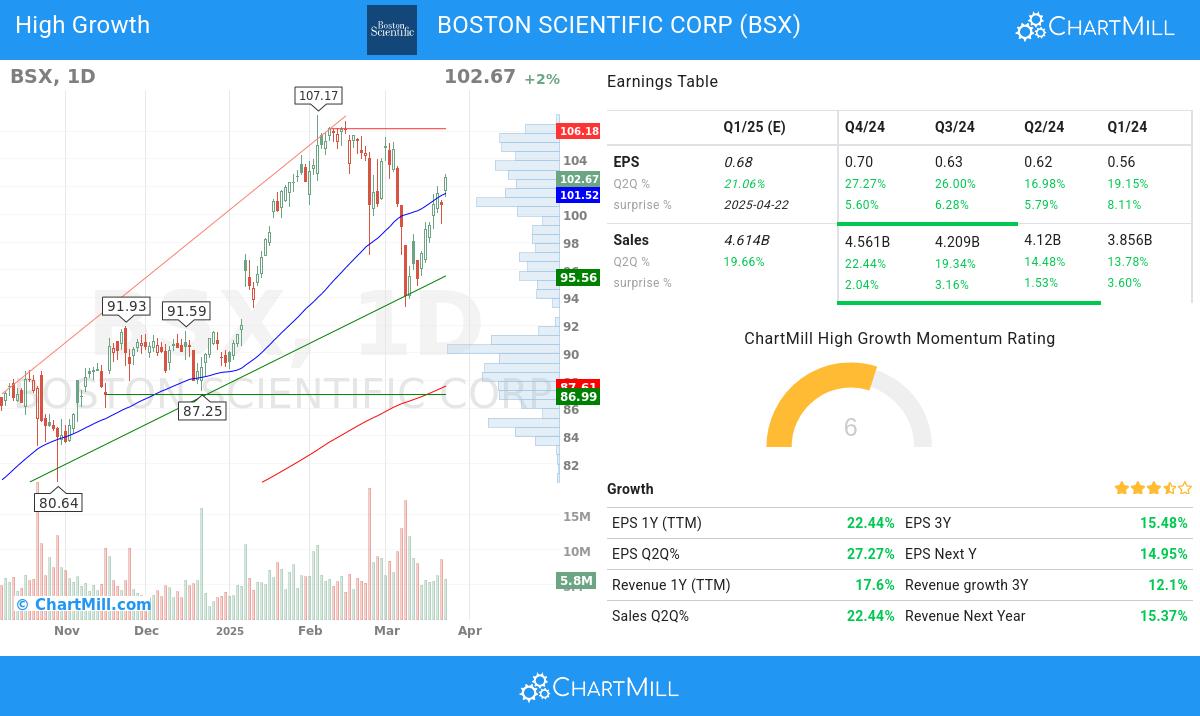
BSX checks all the boxes when evaluating the Minervini Trend Template. This is a set of basic technical criteria to identify stocks in strong uptrends:
- ✔ Relative Strength is above 70.
- ✔ Current price is within 25% of it's 52-week high.
- ✔ Current price is at least 30% above it's 52-week low.
- ✔ The current price is above the 50-, 150- and 200-day SMA price line.
- ✔ The SMA(200) is trending upwards.
- ✔ The SMA(150) is above the SMA(200)
- ✔ The SMA(50) is above the SMA(150) and the SMA(200)
High Growth Assessment of BSX
ChartMill assigns a High Growth Momentum Rating (HGM) to every stock. This score ranges from 0 to 10 and evaluates the different growth and profitability aspects, including accelleration, surprises and revisions. BSX scores a 6 out of 10:
Explosive Earnings Growth
- With a favorable trend in its quarter-to-quarter (Q2Q) earnings per share (EPS), BSX highlights its ability to generate increasing profitability, showcasing a 27.27% growth.
- Accelerating EPS growth for BSX: the current Q2Q growth of 27.27% exceeds the previous quarter Q2Q growth of 26.0%.
- Sales growth accelerated for 3 quarters in a row.
- Over the past year, BSX has demonstrated 22.44% growth in EPS, signifying its positive financial trajectory and potential for future profitability.
- With consistent quarter-to-quarter (Q2Q) revenue growth of 22.44%, BSX exemplifies its ability to generate increased sales and revenue streams. This growth signifies the company's strong business performance and its potential for continued growth.
- BSX shows accelerating Sales growth: when comparing the current Q2Q growth of 22.44% to the previous quarter Q2Q growth of 19.34%, we see the growth rate improving.
- Sales growth accelerated for 3 quarters in a row.
- The average next Quarter EPS Estimate by analysts was adjusted by 4.73%, reflecting the evolving market expectations for the company's EPS growth.
- BSX has consistently surpassed EPS estimates in the last 4 quarters, reflecting its strong financial performance and effective management. This trend suggests the company's ability to generate positive earnings surprises and drive shareholder value.
Profitability & Financial Strength
- With positive growth in its operating margin over the past year, BSX showcases its ability to improve profitability through effective cost control and operational efficiency. This growth underscores the company's commitment to enhancing its financial performance.
- In the past year BSX has expanded its Profit Margin, which demonstrates increasing profitability.
- BSX has shown positive growth in its free cash flow (FCF) over the past year, indicating improved cash generation and financial strength. This growth highlights the company's ability to effectively manage its cash flows and generate surplus funds.
- A Debt/Equity ratio of 0.41 highlights BSX's commitment to maintaining financial stability.
Market Strength & Institutional Confidence
- With institutional shareholders at 93.1%, BSX demonstrates a healthy ownership distribution. This reflects a mix of institutional and individual investors, creating a market environment that may foster increased trading activity and price discovery.
- The Relative Strength (RS) of BSX has consistently been strong, with a current 93.5 rating. This indicates the stock's ability to exhibit relative price outperformance and reflects its competitive strength.
How does the Setup look for BSX
ChartMill assigns a Setup Rating to evaluate the consolidation level of a stock. This rating, ranging from 0 to 10, is updated daily and considers various short-term technical indicators. The current setup rating for BSX is 5:
Although BSX has an excellent technical rating, the quality of the presented setup is not ideal at the moment. Price movement has been a little bit too volatile to find a nice entry and exit point. It is probably a good idea to wait for a consolidation first.
For an up to date full technical analysis you can check the technical report of BSX
More like this
It looks like BOSTON SCIENTIFIC CORP meets the Minervini criteria. More high growth momentum breakout stocks can be found in our High Growth Momentum + Trend Template screen.
Keep in mind
This is not investing advice! The article highlights some of the observations at the time of writing, but you should always make your own analysis and invest based on your own insights.