
Blue Bird Corp (NASDAQ:BLBD) has become a significant option for investors using systematic growth plans. The company's identification comes from a screening process that joins Mark Minervini's Trend Template with high growth momentum standards, forming a two-part method that finds companies displaying both technical soundness and fundamental speed. This process favors securities showing clear upward trends through particular moving average arrangements and price movement features, while also needing strong earnings growth, revenue increase, and positive estimate changes that point to continued business speed.
Technical Base: Meeting the Trend Template
Blue Bird's technical setup matches Minervini's methodical way of finding stocks in clear upward trends. The Trend Template needs particular moving average arrangements and price points that together indicate continued upward movement and lower possible loss.
The stock now meets several Trend Template requirements:
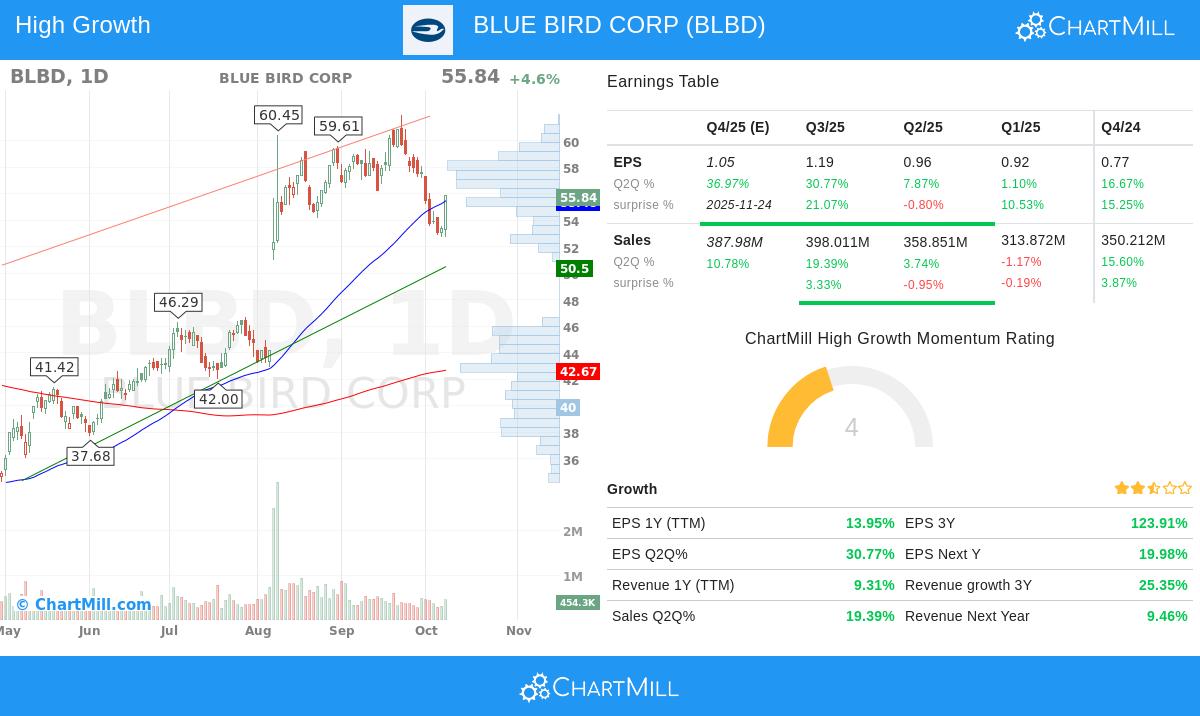
- Current price ($55.84) trades above the 50-day SMA ($55.48), 150-day SMA ($44.27), and 200-day SMA ($42.67)
- The 150-day SMA moves upward and stays above the 200-day SMA
- Current price places 86% above its 52-week low of $30.04
- Relative strength ranking of 83.06 shows better performance against most stocks
- Trading within 10% of its 52-week high of $61.95
These technical features are important because Minervini's work shows stocks in clear stage 2 upward trends—marked by rising moving averages and nearness to new highs—often keep moving upward. The template methodically filters out stocks displaying technical softness while finding those with the greatest chance of continued value increase.
Growth Momentum Basics
Beyond technicals, Blue Bird shows the fundamental speed that high growth investors look for. The company's financial numbers reveal a business seeing major operational betterment and analyst positive outlook.
Recent performance points of note include:
- EPS growth of 225% in the last reported fiscal year
- Quarterly EPS growth speeding up to 31% in the newest quarter
- Revenue growth of 19% year-over-year in the latest quarter
- Three EPS estimate beats in the last four quarters, averaging 12% above expectations
- Profit margin widening from 7.04% to 9.16% over recent quarters
- Analyst EPS revisions for next year increased 7.7% over three months
These fundamental betterments match Minervini's focus on "big earnings attract big attention." The mix of speeding up earnings, widening margins, and positive estimate changes suggests institutional investors may be noticing, possibly supporting further price increase as the company's growth story develops.
Technical Review Summary
According to ChartMill's technical study report, Blue Bird gets a varied but mostly good evaluation. The stock gets a 6 out of 10 on technical rating, reflecting its sound longer-term trend but recent short-term pause. While the long-term trend stays positive, the short-term trend has turned negative as the stock trades near the lower part of its recent $52.73-$61.95 range. The study finds two key support areas between $53.08-$53.92 and at $50.50, giving possible places where buyers might return.
View the complete technical analysis report for detailed insights
Investment Points
For investors following methodical growth methods, Blue Bird offers an interesting case of a company moving from recovery to growth stage. The stock's technical setup shows it has already seen major value increase but keeps its upward trend structure. Fundamentally, the striking earnings betterment and margin widening suggest the company's operational recovery is building force. However, the recent trading range indicates the stock may be pausing its large gains before deciding its next directional step.
Investors using the Minervini method would usually watch such pauses for possible entry points when the stock shows new strength above its recent range, especially if joined by growing volume that suggests institutional buying.
Finding Related Chances
For investors looking for more options that meet similar high growth momentum and trend template requirements, the screening process that found Blue Bird can produce more findings. This methodical way joins technical trend approval with fundamental growth speed to find companies placed for possible continued better performance.
Disclaimer: This analysis is for informational purposes only and does not constitute investment advice, a recommendation, or an offer to buy or sell any securities. Investors should conduct their own research and consult with a financial advisor before making investment decisions. Past performance does not guarantee future results.