
Technical investors often look for stocks showing both good momentum and consolidation patterns that indicate possible breakout chances. One methodical process uses filters for securities with high technical ratings, which assess general trend condition, joined with high setup quality scores that find times of price consolidation. This system helps find stocks that are not only moving in a positive direction but also creating patterns that might come before notable price changes.
Technical Strength Evaluation
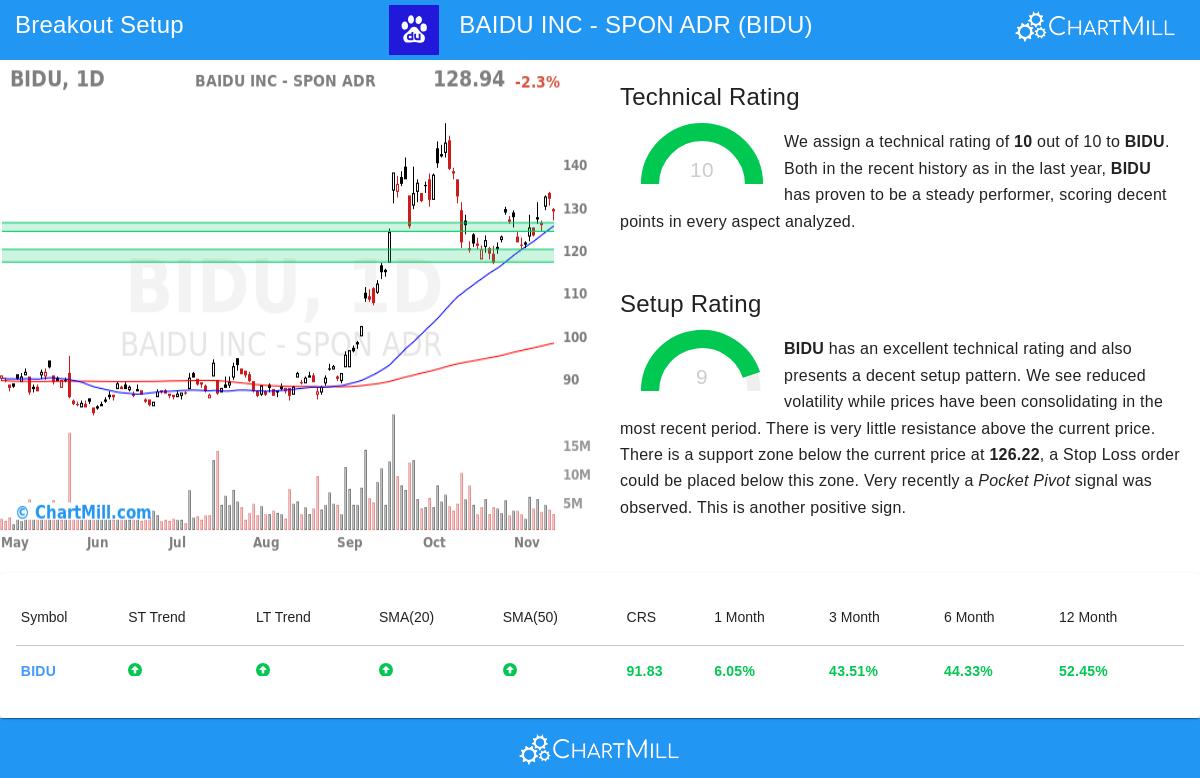
BAIDU INC - SPON ADR (NASDAQ:BIDU) shows interesting technical features based on its detailed technical analysis report. The stock gets a top technical rating of 10 out of 10, signaling very good trend condition over various periods. This highest rating shows several good technical qualities that match the screening method's goal of finding stocks with good underlying momentum.
Important technical positives are:
- Both long-term and short-term trends are clearly positive
- The stock does better than 91% of all stocks in yearly performance reviews
- In the Interactive Media & Services industry, Baidu does better than 86% of similar companies
- All main moving averages (20, 50, 100, and 200-day) are increasing and placed below the present price
- The stock stays in the higher part of its 52-week trading band
These features confirm the screening method's attention to technical ratings, as stocks with ratings of 7 or more usually show continued upward momentum. The top score indicates Baidu shows the kind of steady strength technical investors look for when finding possible breakout choices.
Setup Quality Review
In addition to good technicals, Baidu shows a setup quality rating of 9 out of 10, signaling the stock has moved into a consolidation stage that frequently comes before important price changes. This high setup score meets the method's second key part, finding good entry timing instead of just following stocks that have moved a lot.
The consolidation pattern shows several positive features:
- Prices have been moving between $116.43 and $133.51 during the last month
- Price swings have lessened as the range becomes smaller
- Several support levels are present below current prices, with the closest support area between $124.20 and $126.22
- A recent pocket pivot signal points to institutional buying
- Very little resistance is seen above present price levels
This arrangement gives technical investors clearly stated risk measures. The automatic analysis indicates a possible breakout entry above $133.52 with a protective stop below $124.19, making a specific risk situation. The existence of several support areas and lower price swings creates the kind of setup technical traders often want before entering a position.
Market Situation and Risk Factors
Although Baidu's technical picture looks good, investors should think about several points. The stock trades in a fairly broad monthly range, indicating possible resistance close to the upper limit. Even though it performs better than most stocks yearly, Baidu performs a little worse than the S&P 500, which currently trades near its highest levels. The suggested trade setup has about 7% risk from entry to stop-loss, needing suitable position size to handle portfolio exposure.
Traders using this strategy should watch the stock's capability to move past the $133.52 resistance level with strength. Unsuccessful breakouts could lead to longer consolidation or a move back toward support areas. As with all technical setups, these patterns offer chance-based opportunities, not certain results.
Find More Choices
For investors looking for similar technical setups, the Technical Breakout Setups screen often finds stocks joining high technical ratings with good consolidation patterns. This methodical process helps technical investors effectively locate possible breakout choices in different market situations.
Disclaimer: This analysis is for information only and does not form investment advice, recommendation, or support of any security. All investments carry risk, including possible loss of original investment. Investors should do their own research and talk with a qualified financial advisor before making any investment decisions. Technical analysis patterns do not ensure future performance and past performance does not show future results.