
For investors who use technical analysis to find possible trades, the process often comes to two basic questions: which stock to buy, and when to buy it. A methodical way to answer these questions involves looking for stocks that are both technically sound and building a positive price pattern. This is the heart of the Technical Breakout Setups strategy, which selects for equities with a high ChartMill Technical Rating, showing a good, steady uptrend, and a high ChartMill Setup Quality Rating, indicating a pause that might come before a new upward move. The aim is to find leading stocks that are resting, giving a more distinct entry point with clear risk, instead of following moves that have already advanced far.
Axalta Coating Systems Ltd (NYSE:AXTA), a worldwide maker of coatings systems for the automotive and industrial fields, recently showed up on such a search. Its present technical picture suggests it may be arranging for a possible breakout, making it a stock for investors focused on charts to note.
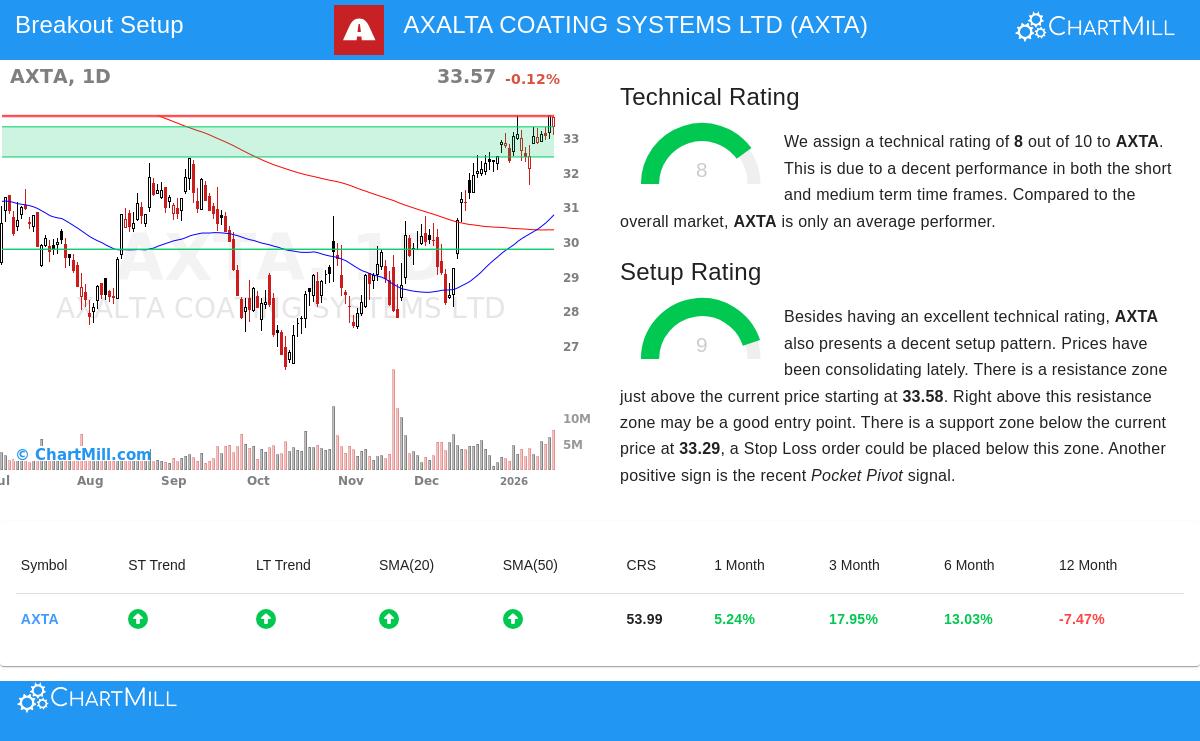
Technical Strength: A Good Base
The first part of the breakout setup method is finding stocks with solid technical strength underneath. A high Technical Rating implies a stock is in a clear uptrend over several time periods, which is important because breakouts from a firm base in a leading stock have in the past shown a better chance of continued movement. Axalta’s technical report gives it a score of 8 out of 10, putting it clearly in positive ground.
The report notes a few main parts adding to this score:
- Trend Agreement: Both the long-term and short-term trends for AXTA are scored as positive. This agreement across time periods shows continued buying interest and lessens the confusion of mixed signals.
- Moving Average Backing: The stock is priced above all its main simple moving averages (20, 50, 100, and 200-day), and each of these averages is itself in a rising pattern. This layered, rising support formation is a typical sign of a sound uptrend.
- Recent Results: The stock has shown notable firmness over the last three months, with an increase of about 18%.
While the report states AXTA’s results over the past year are behind the wider S&P 500, its recent speed and solid trend measures make it a relative leader in its sector. You can see the complete, itemized details in the ChartMill Technical Analysis report for AXTA.
Setup Quality: The Pattern for a Chance
A firm trend by itself is not a signal to buy; entering a stock that has just had a big, fast rise often results in buying at a high point. This is where the Setup Quality Rating becomes key. It measures if a stock is building a positive consolidation, a halt or narrow trading band within the uptrend, which can give a lower-risk entry chance before a possible breakout.
Axalta gets a high Setup Rating of 9, meaning a very good consolidation pattern. The study points to a number of positive markers:
- Set Trading Band: Over the last month, AXTA has traded between about $31.61 and $33.63. It is currently checking the top edge of this band.
- Clear Support and Resistance: The setup finds a clear support area between $32.42 and $33.29, made by a meeting of moving averages and trendlines. Directly above is a set resistance area between $33.58 and $33.62.
- Supportive Behavior: Just lately, the stock activated a "Pocket Pivot" signal, a volume-based sign that suggests buying by large investors during the pause, adding more weight to the setup.
This mix, a narrow band near high prices, with clear support underneath and a specific resistance level to note above, forms a distinct technical picture. The strategy indicates a possible entry on a breakout above the $33.63 resistance, with a stop-loss order set below the support area near $32.41 to control risk.
A Setup to Note
For technical traders, AXTA offers a strong example. It fits the two needs of the breakout screen: sound basic trend condition (Technical Rating of 8) and a high-grade, usable chart pattern (Setup Rating of 9). The existence of a recent Pocket Pivot and clear price points further sharpens the setup. As usual, the important step will be watching price behavior at the noted resistance level for proof of a real breakout, together with careful risk management.
This study of Axalta came from a daily screening process made to find similar technical chances. You can see the present list of possible breakout setups by going to the Technical Breakout Setups screen.
Disclaimer: This article is for information only and is not investment advice, a suggestion, or an offer or request to buy or sell any securities. The study is based on technical data and automated scoring models. Always do your own research, think about your financial position and risk comfort, and talk with a qualified financial advisor before making any investment choices. Past results are not a guide for future outcomes.