
Our stock screening tool has identified ATOUR LIFESTYLE HOLDINGS-ADR (NASDAQ:ATAT) as an undervalued gem with strong fundamentals. ATAT boasts decent financial health and profitability while maintaining an attractive price point. We'll break it down further.
A Closer Look at Valuation for ATAT
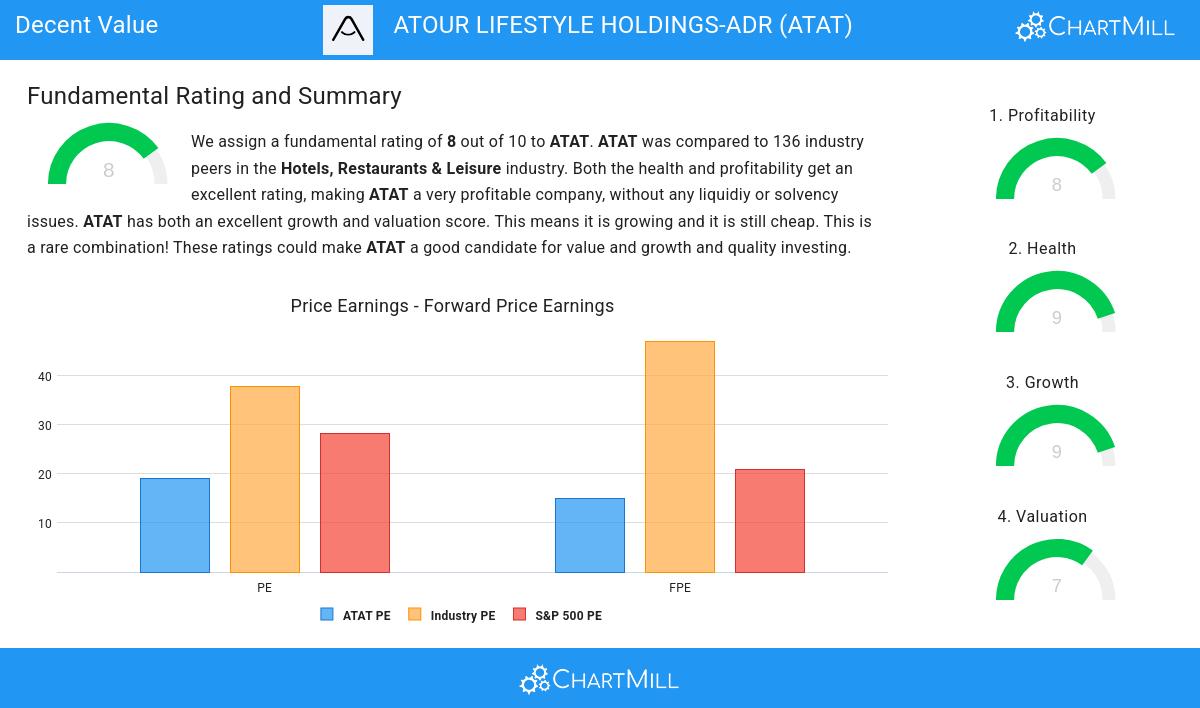
ChartMill provides a Valuation Rating to every stock, ranging from 0 to 10. This rating assesses various valuation aspects, comparing price to earnings and cash flows, while considering factors like profitability and growth. ATAT boasts a 7 out of 10:
- 69.12% of the companies in the same industry are more expensive than ATAT, based on the Price/Earnings ratio.
- ATAT's Price/Earnings ratio indicates a valuation a bit cheaper than the S&P500 average which is at 28.18.
- ATAT's Price/Forward Earnings ratio is a bit cheaper when compared to the industry. ATAT is cheaper than 75.74% of the companies in the same industry.
- ATAT's Price/Forward Earnings ratio indicates a valuation a bit cheaper than the S&P500 average which is at 20.81.
- Based on the Price/Free Cash Flow ratio, ATAT is valued cheaper than 81.62% of the companies in the same industry.
- The low PEG Ratio(NY), which compensates the Price/Earnings for growth, indicates a rather cheap valuation of the company.
- ATAT has an outstanding profitability rating, which may justify a higher PE ratio.
- ATAT's earnings are expected to grow with 23.84% in the coming years. This may justify a more expensive valuation.
How do we evaluate the Profitability for ATAT?
Discover ChartMill's exclusive Profitability Rating, a proprietary metric that assesses stocks on a scale of 0 to 10. It takes into consideration various profitability ratios and margins, both in absolute terms and relative to industry peers. Notably, ATAT has achieved a 8:
- The Return On Assets of ATAT (16.19%) is better than 94.85% of its industry peers.
- ATAT's Return On Equity of 43.14% is amongst the best of the industry. ATAT outperforms 90.44% of its industry peers.
- ATAT has a Return On Invested Capital of 23.71%. This is amongst the best in the industry. ATAT outperforms 94.85% of its industry peers.
- The 3 year average ROIC (15.05%) for ATAT is below the current ROIC(23.71%), indicating increased profibility in the last year.
- The Profit Margin of ATAT (17.60%) is better than 90.44% of its industry peers.
- In the last couple of years the Profit Margin of ATAT has grown nicely.
- ATAT's Operating Margin of 22.38% is amongst the best of the industry. ATAT outperforms 84.56% of its industry peers.
- ATAT's Operating Margin has improved in the last couple of years.
- The Gross Margin of ATAT (85.05%) is better than 97.06% of its industry peers.
ChartMill's Evaluation of Health
ChartMill employs its own Health Rating for stock assessment. This rating, ranging from 0 to 10, is calculated by examining various liquidity and solvency ratios. In the case of ATAT, the assigned 9 reflects its health status:
- ATAT has an Altman-Z score of 5.29. This indicates that ATAT is financially healthy and has little risk of bankruptcy at the moment.
- Looking at the Altman-Z score, with a value of 5.29, ATAT belongs to the top of the industry, outperforming 89.71% of the companies in the same industry.
- The Debt to FCF ratio of ATAT is 0.04, which is an excellent value as it means it would take ATAT, only 0.04 years of fcf income to pay off all of its debts.
- With an excellent Debt to FCF ratio value of 0.04, ATAT belongs to the best of the industry, outperforming 94.12% of the companies in the same industry.
- A Debt/Equity ratio of 0.02 indicates that ATAT is not too dependend on debt financing.
- The Debt to Equity ratio of ATAT (0.02) is better than 88.97% of its industry peers.
- A Current Ratio of 2.02 indicates that ATAT has no problem at all paying its short term obligations.
- ATAT has a better Current ratio (2.02) than 85.29% of its industry peers.
- ATAT has a better Quick ratio (1.96) than 86.03% of its industry peers.
Growth Assessment of ATAT
A key component of ChartMill's stock assessment is the Growth Rating, which spans from 0 to 10. This rating evaluates diverse growth factors, such as EPS and revenue growth, considering both past performance and future projections. ATAT has received a 9 out of 10:
- The Earnings Per Share has grown by an impressive 72.73% over the past year.
- The Earnings Per Share has been growing by 138.03% on average over the past years. This is a very strong growth
- Looking at the last year, ATAT shows a very strong growth in Revenue. The Revenue has grown by 55.34%.
- The Revenue has been growing by 35.84% on average over the past years. This is a very strong growth!
- The Earnings Per Share is expected to grow by 23.84% on average over the next years. This is a very strong growth
- The Revenue is expected to grow by 22.88% on average over the next years. This is a very strong growth
Every day, new Decent Value stocks can be found on ChartMill in our Decent Value screener.
For an up to date full fundamental analysis you can check the fundamental report of ATAT
Disclaimer
Important Note: The content of this article is not intended as trading advice. It is essential to perform your own analysis and exercise caution when making trading decisions. The article presents observations created by automated analysis but does not guarantee any trading or investment outcomes. Always trade responsibly and make independent judgments.