
Investors looking for a methodical way to find leading companies with high growth frequently use the CANSLIM method, made famous by William O’Neil. This approach uses both fundamental and technical study to find firms with powerful earnings increase, yearly expansion, and notable price performance, while also noting the need for positive overall market trends. The aim is to buy top stocks just as they start significant price gains.
A recent filter using main CANSLIM rules has identified ASA Gold and Precious Metals Ltd (NYSE:ASA) as a possible choice. As a closed-end fund that mainly invests in firms involved in the search, extraction, or refining of precious metals, ASA provides a concentrated option in the commodities industry. We will look at how it fits the CANSLIM model.
Fitting the CANSLIM "C" and "A" Rules
The "C" in CANSLIM relates to Current Quarterly Earnings and Sales, needing major and ideally speeding expansion. The "A" calls for solid Annual Earnings Gains, confirming a history of growth.
ASA shows very strong recent expansion in these areas:
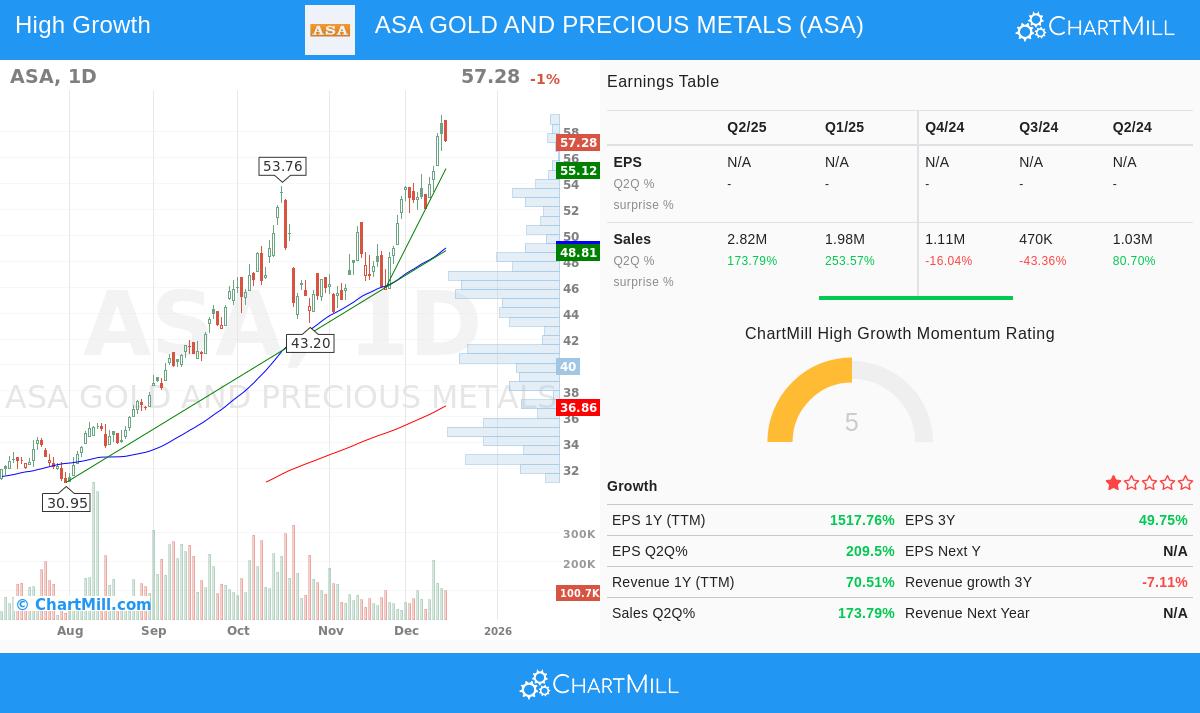
- Quarterly EPS Growth (C): Earnings per share jumped 209.5% versus the same quarter last year, well above the common CANSLIM minimum of 18-25%.
- Quarterly Sales Growth (C): Revenue expanded by a notable 173.8% year-over-year, showing powerful top-line movement.
- Annual Earnings Growth (A): The 3-year EPS compound annual growth rate (CAGR) is 49.7%, indicating a continued history of large profit growth that matches the system's view on confirmed growth paths.
Reviewing Financial Condition and Market Position
The "S" and "L" rules look at Supply/Demand factors and market Position. CANSLIM prefers companies with sound financial statements and better price action compared to the wider market.
ASA's details show positive signs here:
- Debt and Liquidity (S): The firm has no debt, leading to a Debt/Equity ratio of 0. This outstanding financial condition reduces risk and is a good supply-side point. The firm also has high liquidity measures.
- Market Position (L): ASA's relative strength score is a high 97.61, meaning it has done better than almost 98% of all stocks in the last year. This is a key part of the CANSLIM idea, which states that the market's best performers often keep their leading position.
Institutional Investment and Present Pattern
The "I" centers on Institutional Investment, looking for stocks that are being bought by professional money managers but are not yet extremely held by them. ASA's institutional holding is about 64.6%, which is under the 85% level often used to sidestep very popular trades. This points to potential for more institutional purchases.
From a chart view, ASA's score is positive. The stock is in a confirmed upward pattern on both short and long-term views and is changing hands close to its 52-week peak, a common trait of CANSLIM breakouts. Still, the technical analysis report mentions that recent price swings may need caution, watching for a clearer period of stability or decline to find a lower-risk entry point, a detail that fits with O’Neil's focus on "well-made chart patterns."
Fundamental and Price Assessment Context
ASA's fundamental analysis report shows a varied view that needs explanation. The total fundamental score is moderate, affected by questions on profit stability and an absence of future analyst projections. However, the key measures for a CANSLIM filter, very strong recent EPS/sales expansion and a high Return on Equity (54.75%), are clearly seen.
It is important that the stock trades at a Price/Earnings ratio near 5.7, which seems very low next to the S&P 500 average. For a growth-oriented method like CANSLIM, a low P/E is not automatically a good point; it can signal a missing market trust in future expansion. For ASA, it may show the changing nature of the commodities industry instead of the firm-specific growth now being seen.
Summary for CANSLIM Investors
ASA Gold and Precious Metals makes a strong argument for CANSLIM-focused investors because of its outstanding results on several measurable system parts: very high quarterly earnings and sales expansion, a solid multi-year annual EPS growth rate, a clean debt-free financial statement, and top-level market-leading relative strength. Its institutional holding percentage is in a good band.
The main points for thought are industry-specific price movement, the lack of future expansion estimates common to many commodity-based investments, and the present chart view that the stock may be advanced in the near term. For investors who think the precious metals idea has more room to progress, ASA offers a tool that has lately shown the exact type of strong fundamental and chart movement the CANSLIM system was created to find.
Find additional stocks now meeting related CANSLIM-based filters by viewing the set filter here.
Disclaimer: This article is for information only and is not financial guidance, a suggestion, or a bid to buy or sell any securities. The CANSLIM method carries risk, and prior results do not guarantee future outcomes. Investors must do their own complete study and think about their personal money situation before any investment actions.