
For investors looking for a systematic way to find high-growth market leaders, the CANSLIM method, created by William O'Neil, is a foundational plan. It mixes strict fundamental study with important technical signs to find stocks with solid earnings momentum, institutional support, and good price performance, best bought when the overall market is positive. This structured system tries to take part in major price advances in stocks that are both fundamentally healthy and gaining market attention.
A recent filter using this plan has identified ASA Gold and Precious Metals Ltd (NYSE:ASA), a closed-end fund concentrated on the precious metals area. While its setup as a holding company is not the same as a standard operating firm, its investment holdings and recent results offer a strong reason for review using the CANSLIM view, especially for investors positive on gold and minerals.
Assessing ASA Using CANSLIM Standards
The CANSLIM letters list particular standards for stock choice. Here is how ASA compares according to the given information:
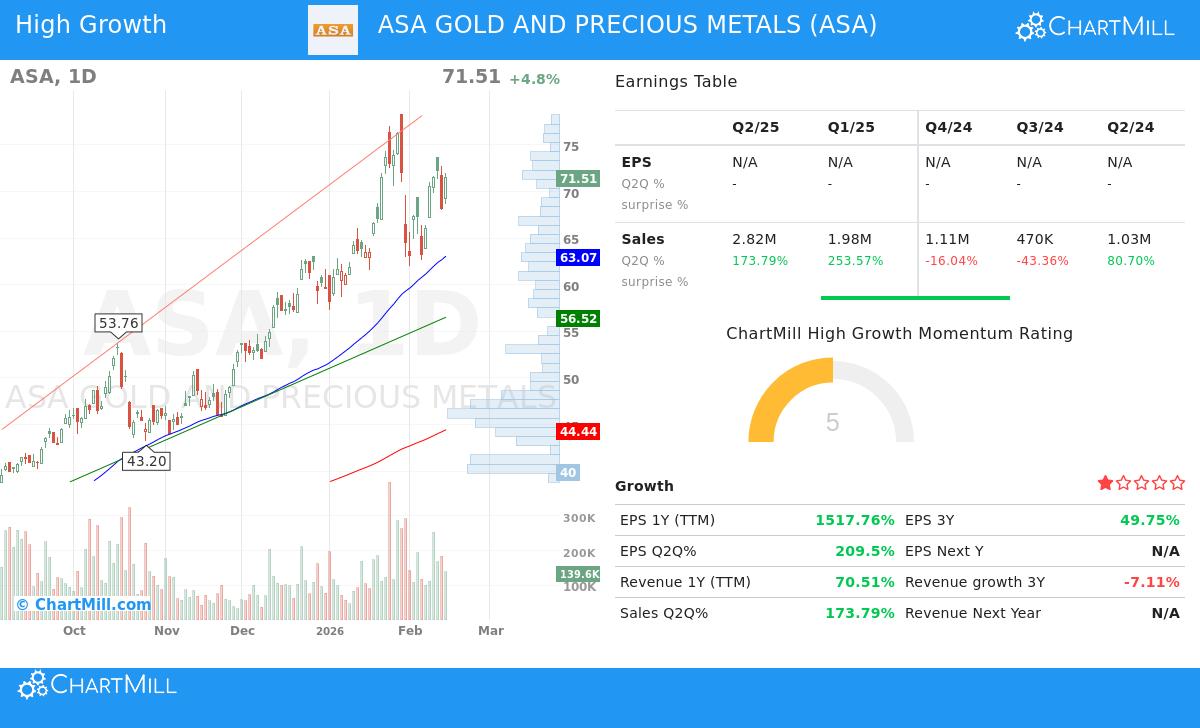
- C - Current Quarterly Earnings & Sales: This standard requires solid, and ideally speeding up, recent expansion. ASA states a very high 209.5% year-over-year EPS gain and a 173.8% rise in revenue for the latest quarter. These numbers are much higher than the usual CANSLIM minimums of 20-25%, showing strong fundamental momentum, probably caused by positive changes in precious metals prices.
- A - Annual Earnings Increases: The plan seeks a demonstrated history of growth. ASA displays a 3-year EPS compound annual growth rate (CAGR) of about 49.7%, which is very high and exceeds the 25-50% range O’Neil recommends. Also, its Return on Equity (ROE) of 54.75% shows very effective use of shareholder money, well above the 10% minimum.
- N - New Highs & Innovation: While ASA is not a "new" firm, its investment focus on firms in exploration, mining, and processing matches the thematic look for "new" economic forces, here being lasting need for precious metals. From a technical view, a main part of "N" is the stock reaching new price highs, showing market notice of its performance.
- S - Supply & Demand: ASA does very well in the "supply" part with a Debt/Equity ratio of 0.0, meaning no debt and a very clean balance sheet. This financial state is a major positive. The "demand" part is judged through trading activity and price movement.
- L - Leader or Laggard: This is where ASA performs best from a technical view. The stock has a ChartMill Relative Strength (CRS) rating of 97.74. This indicates it has done better than almost 98% of all stocks in the market over the last year, a clear sign of a market leader, which is key to the CANSLIM idea of buying the top performers.
- I - Institutional Sponsorship: CANSLIM prefers stocks with institutional ownership that is meaningful but not too high, leaving space for more buying. ASA’s institutional ownership is 65.17%, which is lower than the 85% limit used in the filter. This implies institutions are invested but there is still possibility for more institutional buying.
- M - Market Direction: The plan stresses matching stock buys with the general market trend. At this time, the S&P 500 shows an upward short-term trend, which gives a generally good setting for following CANSLIM-style investments.
Fundamental and Technical Review
A look at ASA’s separate reports gives a wider view beyond the filter's settings.
The fundamental analysis report gives ASA a score of 3 out of 10, pointing to a mixed situation. The good points are notable: very high recent EPS and revenue growth, excellent financial health with no debt, and good cash position. However, the report mentions questions about long-term profit patterns and a lack of obtainable future growth projections, which adds doubt. The stock price valuation, with a P/E ratio near 7, seems low compared to the wider market but may show the natural instability and cycles of the commodities area.
In clear difference, the technical analysis report gives a top score of 10 out of 10. It confirms the leader status shown by the high relative strength, noting ASA has outperformed 97% of stocks. Both its short-term and long-term trends are scored as positive, with the stock priced above important average lines. The report also finds an acceptable price pattern, with recent stability and clear support levels under the current price, a technical position that often appeals to CANSLIM investors seeking buying opportunities.
Summary
ASA Gold and Precious Metals shows a distinct picture for CANSLIM-focused investors. It strongly meets the main number-based filters for very high quarterly growth, excellent annual EPS growth, high relative strength, and acceptable institutional ownership. Its technical position is very strong, identifying it as a clear leader. Still, investors must balance these positives against the fundamental report’s warning on long-term earnings stability and the company’s character as a focused fund linked to the unstable precious metals sector. It acts as a clear instance of how the CANSLIM plan can identify strong momentum situations, which then need more detailed study on the durability and causes of that momentum.
This review of ASA came from a set CANSLIM plan filter. To see other stocks currently fitting these strict growth and momentum standards, you can see the complete O'Neill CANSLIM High Growth screen.
Disclaimer: This article is for information only and is not investment advice, a suggestion, or an offer to buy or sell any security. The CANSLIM method includes risk, and past results do not guarantee future outcomes. Investors should do their own study and think about their personal financial situation and risk comfort before making any investment choices.