
The method used to find possible investment candidates joins a strict technical system with attention to fundamental growth momentum. This process is based on the strategy made common by trader Mark Minervini, which aims to find stocks in strong, continuing upward movements (Stage 2) by using a fixed group of price and moving average rules called the Trend Template. This confirms a stock is showing clear technical health and agreement with the current market direction. To add to this, the filter includes a High Growth Momentum (HGM) rating, which measures a company's latest financial results on items like earnings and sales growth, speed of growth, and analyst estimate changes. The aim is to find companies that are both technically healthy and showing the fundamental speed that frequently drives major price gains.
ARCUTIS BIOTHERAPEUTICS INC (NASDAQ:ARQT) results from this two-step filtering process as a stock deserving more detailed study. The dermatology-centered biopharmaceutical company, recognized for its main product ZORYVE, seems to match the standards looked for by both trend-following and growth-focused investors.
Technical Agreement with the Minervini Trend Template
A central idea of the Minervini strategy is to invest in the direction of a verified uptrend, staying away from speculative attempts to buy at lows. The Trend Template gives a step-by-step list to check this health. Using the given data, ARQT shows a strong technical picture:
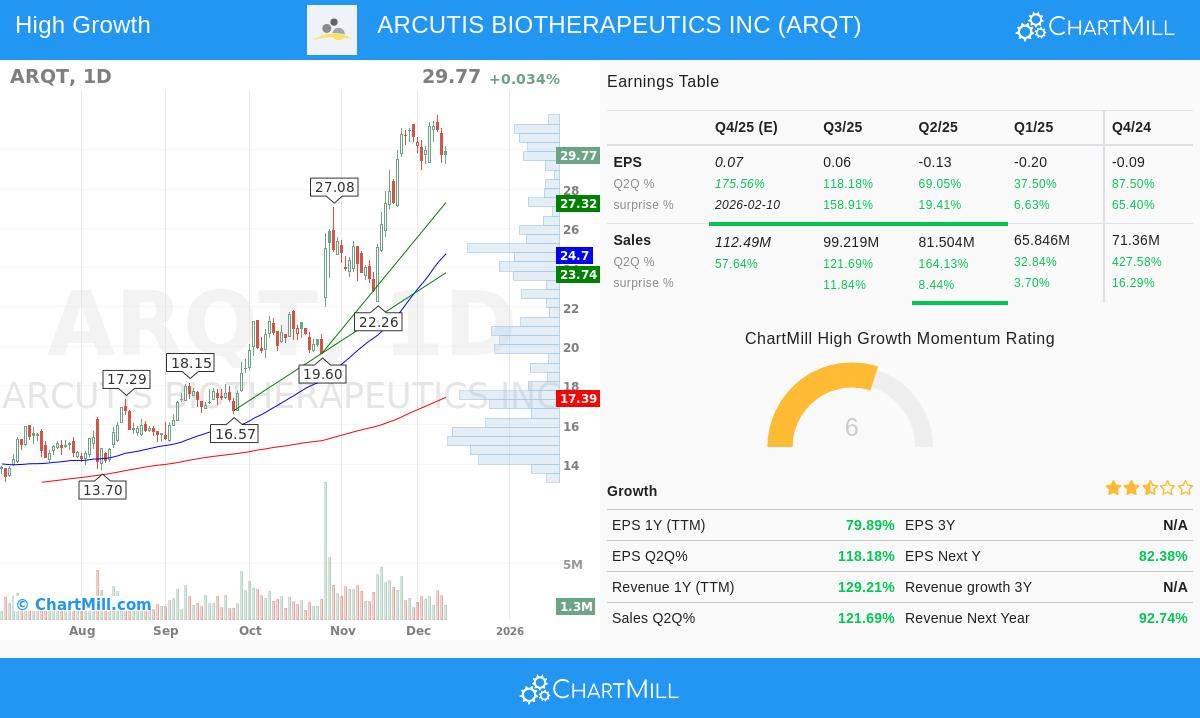
- Price Above Important Moving Averages: The present price ($29.77) trades notably above the rising 50-day ($24.70), 150-day ($18.28), and 200-day ($17.39) simple moving averages (SMAs). This agreement verifies the stock is in a clear positive stage across several time frames.
- Moving Average Order: The 50-day SMA is above both the 150-day and 200-day SMAs, and the 150-day SMA is above the 200-day SMA. This ordered layering of shorter-term averages above longer-term ones is a standard indicator of increasing upward speed and institutional buying.
- Nearness to Highs: The stock is trading within 6.3% of its 52-week high ($31.77), satisfying the "within 25% of the high" rule. This shows the stock is displaying leadership and health instead of bouncing back from large declines.
- Major Gain from Lows: ARQT's present price is about 168% above its 52-week low ($11.13), greatly passing the 30% minimum. This large gain from the lows proposes a major trend shift has already occurred.
- Strong Relative Performance: With a ChartMill Relative Strength (CRS) rating of 97.06, ARQT is doing better than 97% of all stocks in the market over the past year. High relative performance is a foundation of the Minervini method, as it finds market leaders that often keep leading.
Fundamental Speed for Growth Investors
While the Trend Template deals with the "when" to buy, the High Growth Momentum rating tries to answer "why" the stock might keep performing. ARQT's given fundamental numbers show a company in a strong growth stage, which is important for maintaining a strong uptrend.
- Very High Revenue Growth: The company is showing outstanding top-line increase. Revenue growth on a trailing twelve-month (TTM) basis is over 129%, and the latest quarter saw year-over-year sales growth of about 122%. Such high growth rates are a main force for momentum investors.
- Quickly Getting Better Earnings Path: Maybe more strong is the move toward profit. While the company reports a negative EPS on a TTM basis, the rate of improvement is sharp. Year-over-year EPS growth is almost 80%, and the growth increased to over 118% in the last quarter. This sequence of positive earnings increase is a main sign in growth investing.
- Steady Analyst Trust: The company has exceeded both earnings and revenue estimates in each of the past four quarters, with an average EPS beat of over 62%. Also, analysts have notably raised their estimates for the next fiscal year, with the average EPS estimate changed upward by 56.4% over the past three months. Upward changes often come before more institutional buying and price speed.
- Industry Leadership: Inside the competitive Biotechnology field, made of over 530 stocks, ARQT's technical rating shows it is doing better than 89% of its group. This industry-relative performance is another sign of a genuine market leader.
Present Technical Condition and Position
The complete technical study report for ARQT gives the stock a top rating of 10 out of 10, showing outstanding technical condition. The long-term and short-term trends are both rated as good, and the stock is trading near 52-week highs in line with the wider S&P 500. The report finds several support levels, with the closest area between $29.43 and $29.76, which can act as a guide for risk management.
However, the report states that the present Setup Quality rating is a 4. This proposes that after its major rise, the stock may be starting a time of consolidation or increased instability. For investors following the Minervini method, this shows that while the stock's trend is perfect, a good lower-risk entry point may need waiting for a tighter, more clear price formation to appear. The strategy stresses waiting for such consolidations, like a Volatility Contraction Pattern (VCP), to give a higher-chance entry.
You can examine the full, detailed technical study for ARQT through its Technical Analysis Report.
Locating Comparable Chances
ARCUTIS BIOTHERAPEUTICS INC offers an example of a stock that agrees with a strict growth and momentum strategy. For investors looking to systematically search for similar candidates that meet both the Minervini Trend Template and show high growth momentum, more study can be done using the prepared filter.
Find more stocks that match this joined growth and momentum description by examining the High Growth Momentum + Trend Template screen.
Disclaimer: This article is for informational and educational purposes only. It is not intended as investment advice, a recommendation, or an offer to buy or sell any security. The analysis is based on data provided and reflects conditions at a specific point in time. Investors should conduct their own thorough research, consider their financial situation, risk tolerance, and investment objectives, and consult with a qualified financial advisor before making any investment decisions. Past performance is not indicative of future results.