
For technical investors, the search for promising trades often comes to two basic questions: which stock is in a solid trend, and when is the best time to enter that trend. A methodical way to answer these questions involves screening for stocks that combine sound basic technical condition with a good price consolidation pattern, indicating a possible breakout. This process finds market leaders that are resting before their next possible move up, providing a more distinct entry point with clear risk.
One stock currently found on such scans is Arcutis Biotherapeutics Inc (NASDAQ:ARQT), a biotech company working on skin treatments. According to a recent technical analysis, ARQT shows a profile that fits the breakout setup method, justifying more attention from traders focused on price action.
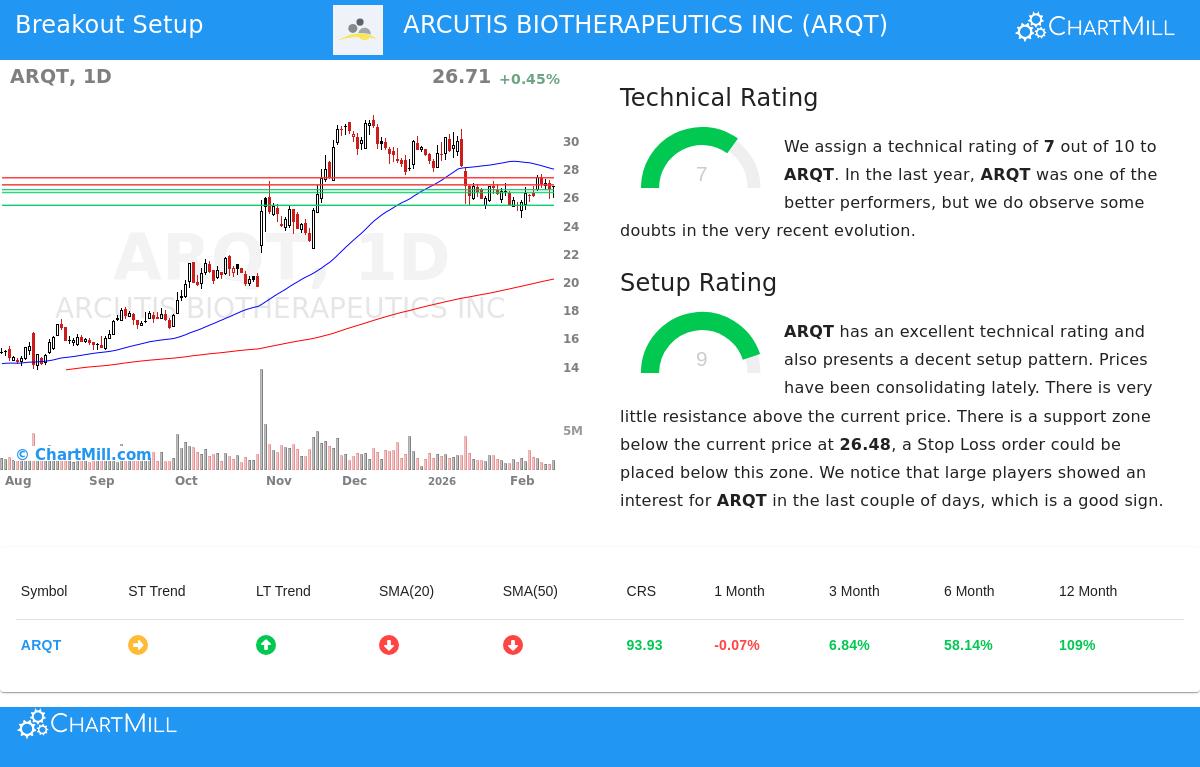
Examining the Technical Base
The first part of a breakout method is finding stocks with solid basic technical momentum. A stock must be in a verified uptrend to have a better chance of moving up after a breakout. The ChartMill Technical Rating for ARQT is a 7 out of 10, which places it as a stock in an uptrend.
This rating is backed by several important points from the technical report:
- Long-Term Trend Condition: The long-term trend is rated as positive, which is the main directional view for trend-based methods. This is further shown by the stock trading well above its rising 100-day and 200-day simple moving averages.
- Better Relative Performance: Over the last year, ARQT has done much better than the wider market, beating 93% of all stocks. It also scores well within its own biotechnology field, doing better than 82% of similar companies.
- Stable Price Action: The report states that the gains over the last year have been "nicely spread over this period," pointing to a consistent, maintainable rise instead of a speculative jump.
This firm technical rating is important because it answers the "which stock" question. It shows ARQT is a market leader with momentum, making it a more fitting choice for a long breakout trade than a stock stuck in a downtrend or a flat range.
Judging the Setup Condition
A solid trend by itself is not a buy signal. Entering a stock that has just made a big, stretched move often results in buying at a high. The second part of the method is timing, which is measured by the Setup Quality Rating. ARQT gets a very good 9 out of 10 in this area.
This high score indicates that the stock is in a helpful consolidation stage, which usually comes before a new breakout. The technical report explains why the setup looks positive:
- Clear Trading Range: In the past month, ARQT has been trading between $24.50 and $27.62. It is currently consolidating in the middle of this range, having moved down from recent highs. This tightening action can build pressure for the next directional move.
- Distinct Support and Resistance: The analysis finds a nearby support area between $26.26 and $26.48, made by a mix of trendlines and moving averages. Just above the current price, resistance is seen around $26.82. This creates a clear zone where a move above resistance could signal the beginning of a new upward move.
- Institutional Activity: A positive point in the report is that "large players showed an interest for ARQT in the last couple of days," as seen in volume analysis. Buying during a consolidation can be a positive indicator.
This high setup condition addresses the "when to buy" question. It suggests the stock is not overbought and is forming a base, giving a logical area to place a buy order above resistance with a protective stop-loss order below the noted support area.
A Possible Trade Plan
Based on this analysis, the technical report proposes a specific, sample trading setup. It suggests an entry at $26.83, which is a buy-stop order placed just above the immediate resistance. A stop-loss order is proposed at $26.25, placed below the support area, which would cap the loss on the trade to about 2.2%. It is very important to know this is an automated sample for learning, not a suggestion. Traders must always do their own analysis, change position size to their individual risk level, and know about company-specific news or events like earnings reports.
Locating Comparable Chances
The approach that found ARQT can be used methodically to the whole market. For investors wanting to see a new list of possible breakout setups that meet similar standards of firm technicals and good-quality consolidations, new choices are found each day.
You can find today's technical breakout setups by visiting the Technical Breakout Setups screen.
Disclaimer: This article is for information and learning only. It is not investment advice, a suggestion, or an offer to buy or sell any security. The trading setup noted is an automated, hypothetical sample for illustration. Investing in stocks includes risk, including the possible loss of principal. You should do your own research and talk with a qualified financial advisor before making any investment decisions.