
For investors looking for a structured path to growth, joining basic momentum with chart-based timing can be an effective plan. This process finds firms showing forceful, speeding earnings and sales expansion, a sign of high-growth momentum, and then using chart study to find better entry points during times of pullback. The aim is to join in a stock’s next rise while controlling risk through clear formations. Packaging leader AMCOR PLC (NYSE:AMCR) recently appeared in a search made to find these chances, fitting needs for both forceful growth momentum and a good chart formation.
Basic Growth Momentum
The heart of a high-growth momentum plan rests in finding companies with forceful and often speeding earnings strength. AMCOR’s latest financial results show several strong data points that add to its firm score in this group.
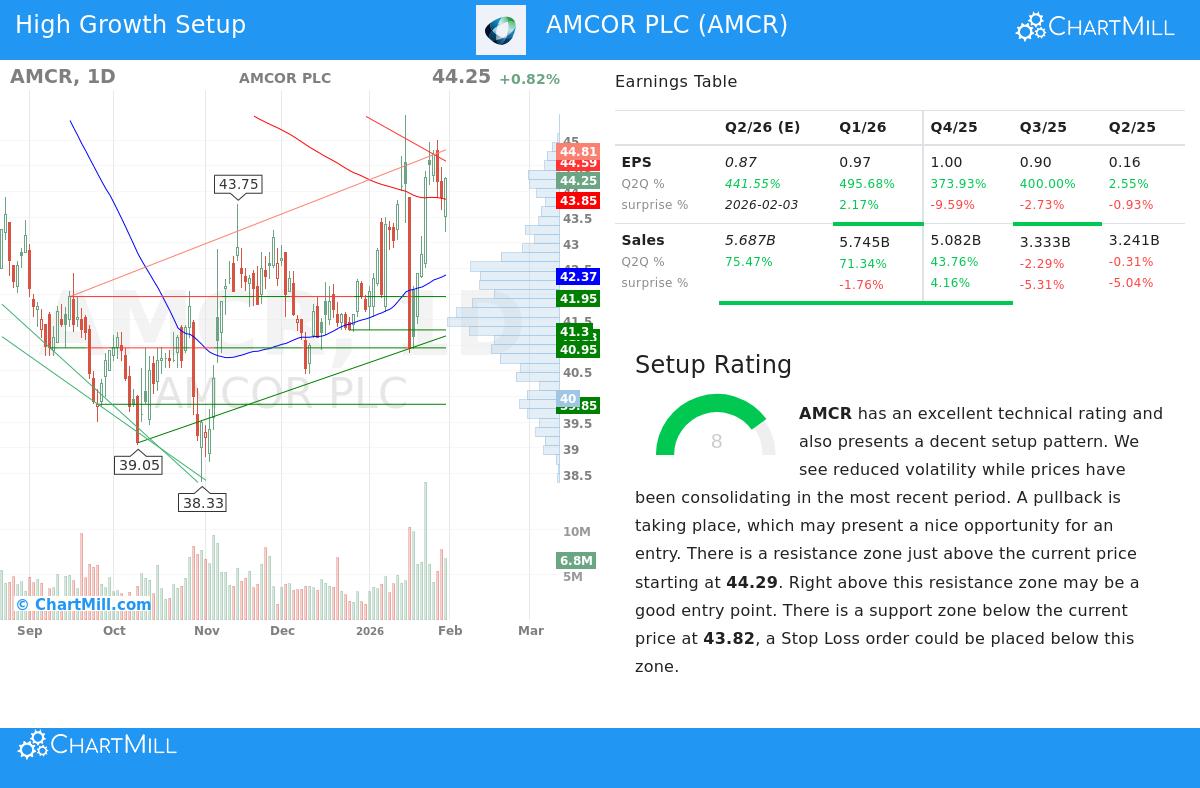
- Outstanding Earnings Growth: The company’s quarterly earnings per share (EPS) growth compared to the year before has been striking. The latest quarter showed growth near 496%, after a 374% rise the quarter before. This rapid speed change from smaller growth earlier in the year is a main good sign.
- Forceful Sales Speed Return: After a time of flat to falling sales, revenue growth has started again. The last reported quarter showed sales growth above 71%, with forecasts pointing to more speed change above 75% in the next quarter. This speed return is a key part for keeping momentum.
- Analyst Trust: Maybe one of the clearest signs for momentum investors is analyst estimate change. Over the last three months, the average forecast for AMCR’s next-year EPS has been moved up by a notable 402%, showing strong and rising trust in the company’s short-term profit path.
While the company’s profit margins have had some drop from higher points in past years, a point to watch, the pure size of the sales speed return and bottom-line growth, joined with largely positive estimate changes, forms a strong basic view for momentum investors.
Chart Strength and Formation Quality
A good growth story is only one piece; good market timing is the other. Based on the full ChartMill Technical Report, AMCR now shows a helpful chart setting that matches a breakout formation plan.
The report gives AMCR a Chart Score of 7 out of 10, stating that while its longer-term path is neutral, the short-term path has turned positive. More key, the stock gets a high Formation Score of 8. This mark finds times of pullback where price movement lessens and the stock forms a base, often before a new price move.
Main chart notes include:
- Pullback Happening: The study states "lessened price movement while prices have been pulling back in the latest period," which is a standard trait of a stock winding before a possible breakout.
- Set Support and Resistance: The report clearly marks close support and resistance areas. A main resistance zone sits just above the present price, between $44.29 and $44.73. A clear move above this zone could show a chart breakout.
- Controlled Risk View: With support levels marked below, traders can set a sensible area to place stop-loss orders, allowing for a measured risk-reward check on any breakout try.
This pairing, a chart-sound stock coming out of a pullback phase, gives a clear answer to the "when" question for investors persuaded by the "why" of the basic growth story.
A Joining Chance
AMCOR PLC shows a case where basic momentum and chart stance are joining. For the high-growth momentum investor, the company’s rapid quarterly EPS growth, returning sales speed, and largely positive analyst changes mark the key boxes for earnings momentum. At the same time, the chart study hints the stock is not overstretched; instead, it is forming a possible breakout pattern with clear levels to set entry and control risk.
This match is just what the joined search method aims to find: companies with the drive of strong earnings momentum that are also chart-ready for a possible move higher. It shows the plan’s idea that the top growth chances are not only about strong basics, but about finding them at a chart-good time.
Want to find more stocks that fit this high-growth momentum with breakout formation view? You can run the search yourself using this High Growth Momentum Breakout Formations Search.
Notice: This article is for learning only and is not financial guidance, a suggestion, or a bid to buy or sell any securities. The study shown uses data and sources thought to be sound, but its correctness is not assured. Investing holds risk, including the chance to lose original funds. Always do your own study and think about talking with a skilled financial guide before making any investment choices.