
Investors looking to find high-potential stocks during trending markets frequently use systematic methods that mix strict technical and fundamental analysis. One method is the strategy made famous by Mark Minervini, a two-time U.S. Investing Champion. His system, contained in the Specific Entry Point Analysis (SEPA) method, focuses on locating stocks with powerful earnings momentum that are already in clear, technically good uptrends. The aim is to seize the early parts of a stock's most powerful price moves by confirming it satisfies a fixed group of standards before any investment is made. This two-part method, combining a solid "Trend Template" for technical condition with attention to improving fundamentals, works to remove poor performers and focus money on market leaders.
A recent scan made to find candidates matching this high-growth, momentum-focused strategy has pointed to ALAMOS GOLD INC-CLASS A (NYSE:AGI). The scan first uses Minervini's Trend Template to confirm a good technical base, then adds a High Growth Momentum (HGM) rating to make sure the company's business fundamentals match the price action. We can look at why AGI seems to fit under this joined framework.
Satisfying the Minervini Trend Template
Minervini's Trend Template is a basic technical list made to confirm a stock is in a forceful, continuing uptrend, what he calls a "Stage 2" advance. It goes further than simple price gains to study the order of key moving averages and relative strength. For a stock like AGI, the present technical view matches these strict needs closely.
- Price Above Key Moving Averages: AGI's present price is located above its rising 50-day, 150-day, and 200-day simple moving averages (SMAs). This ordered position shows bullish momentum across short, intermediate, and long-term periods.
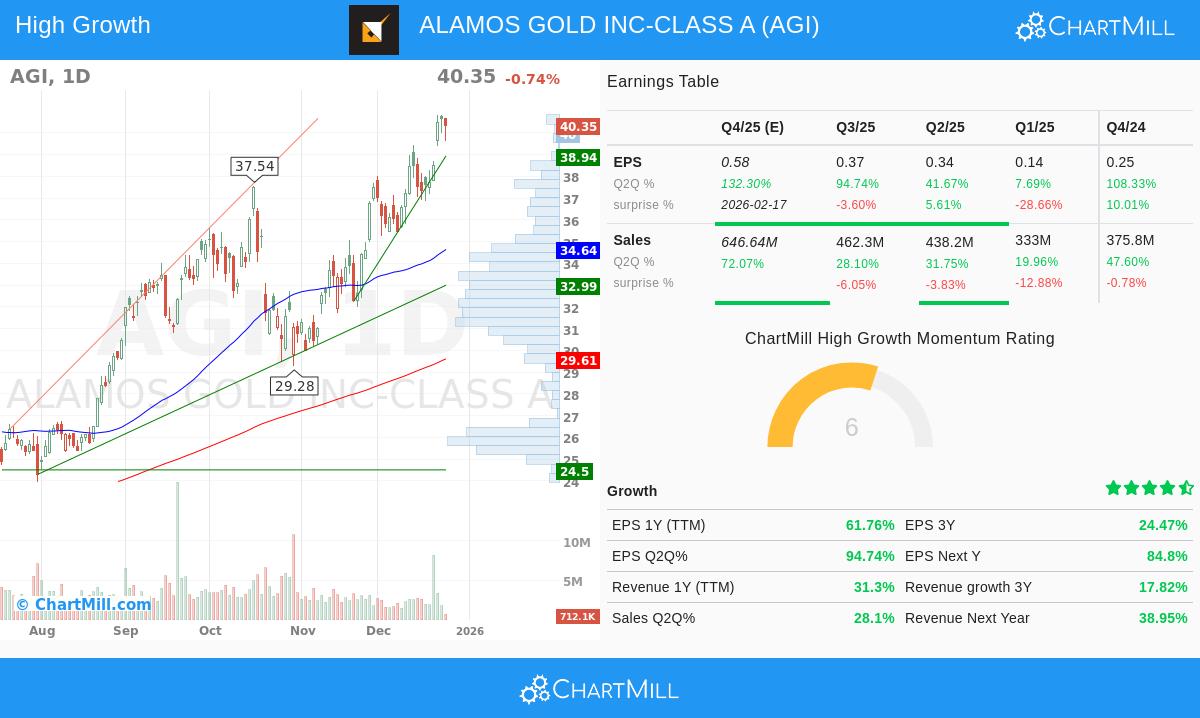
- Moving Average Order: Importantly, the 50-day SMA ($34.64) is above both the 150-day SMA ($30.61) and the 200-day SMA ($29.61), and the 150-day SMA is above the 200-day SMA. This successive bullish order is a central part of the Trend Template, verifying that the trend is arranged and forceful.
- Nearness to Highs: The stock is trading within 25% of its 52-week high of $40.82, another key filter. Minervini's work shows that market leaders often make their largest moves from a position of force near new highs, not from very oversold lows.
- Better Relative Strength: With a ChartMill Relative Strength (CRS) rating of 95.23, AGI is doing better than about 95% of all stocks in the market over the past year. High relative strength is essential in the Minervini strategy, as it finds the stocks that institutions are buying, often before a large breakout is seen by the wider market.
This meeting of technical factors indicates AGI is not only rising but is doing so with the kind of organized, leadership-quality trend that Minervini's method aims to use.
Fundamentals Matching High Growth Momentum
While a good chart is necessary, Minervini states that the largest winners are nearly always backed by strong fundamental improvements. The "High Growth Momentum" part of the scan confirms the company's financial performance supports the technical force. AGI's recent fundamental numbers show clear momentum.
- Earnings Improvement: The company is showing fast growth in profitability. Year-over-year EPS growth for the trailing twelve months is at a notable 61.8%. More significantly, the most recent quarterly EPS jumped 94.7% compared to the same quarter last year, showing a powerful improvement in earnings momentum, a key driver for more price gains.
- Strong Revenue Growth: Top-line growth is also good, with TTM revenue up over 31%. The latest quarter saw sales grow 28.1% year-over-year, giving a firm base for the earnings increase.
- Growing Profitability: The fundamental gain is further shown by growing profit margins. The net profit margin in the last reported quarter was about 59.8%, a clear growth from 36.4% in the previous quarter. This points to not only higher sales, but better operational efficiency and pricing ability.
- Positive Estimate Changes: Analysts are noticing, with the average EPS estimate for the next fiscal year changed upward by 2.76% over the last three months. Upward changes often come before institutional buying and can be an early signal for stock price movement.
This mix of improving earnings, good sales growth, and margin growth creates the fundamental "force" that can maintain a major technical uptrend, fitting well with the high-growth part of the scanning strategy.
Technical Condition and Setup Evaluation
Beyond the specific Trend Template filters, a wider view of AGI's technical condition is strong. According to ChartMill's own analysis, the stock receives a perfect Technical Rating of 10 out of 10, putting it in the top group of performers in the market from a trend view. Both its long-term and short-term trends are rated as positive, and it has steadily done better than most stocks.
However, the analysis also gives a note of care for immediate entry. While the technical condition is very good, the present Setup Quality rating is a medium 5. The evaluation states that price movement has been "a little bit too volatile to find a nice entry and exit point," suggesting the stock may be stretched in the short term after its large rise. For users of the Minervini strategy, this shows the need for patience and waiting for a calm period or pullback to a defined support area, such as the noted zone between $38.47 and $38.94, before trying to make a low-risk entry point. A full list of the support levels and technical factors is available in the full ChartMill Technical Report for AGI.
Locating Comparable Chances
AGI acts as a real example of how joining Minervini's trend-focused rules with a filter for high fundamental growth can reveal potential investment candidates. For investors wanting to examine other stocks that presently meet this strict group of standards, the scanning method is open to the public. You can see the present results and change the settings for your own study by going to the "High Growth Momentum + Trend Template" scan on ChartMill.
Disclaimer: This article is for information and learning only. It is not a suggestion to buy or sell any security. The analysis is based on data and a specific scanning method, but past performance is not a guide to future results. All investing contains risk, including the possible loss of principal. You should do your own complete study and think about talking with a qualified financial advisor before making any investment choices.