
For investors focused on chart patterns and momentum, a systematic method can help find stocks ready for their next price increase. One such process involves looking for companies that are in good technical condition and are also trading in a narrow band, hinting a price move may be close. This tactic uses two specific measures from ChartMill: the Technical Rating, which judges the general strength and direction of a stock, and the Setup Quality Rating, which judges the condition of its present trading pattern. A stock with high marks on both counts makes a strong case for technical investors searching for clear entry and exit points.
AERCAP HOLDINGS NV (NYSE:AER) has recently appeared from such a search, showing a profile that fits well with this breakout method. As one of the world's largest aircraft lessors, AerCap's core business is linked to global air travel demand, but its recent price movement tells a separate technical story that is worth a look.
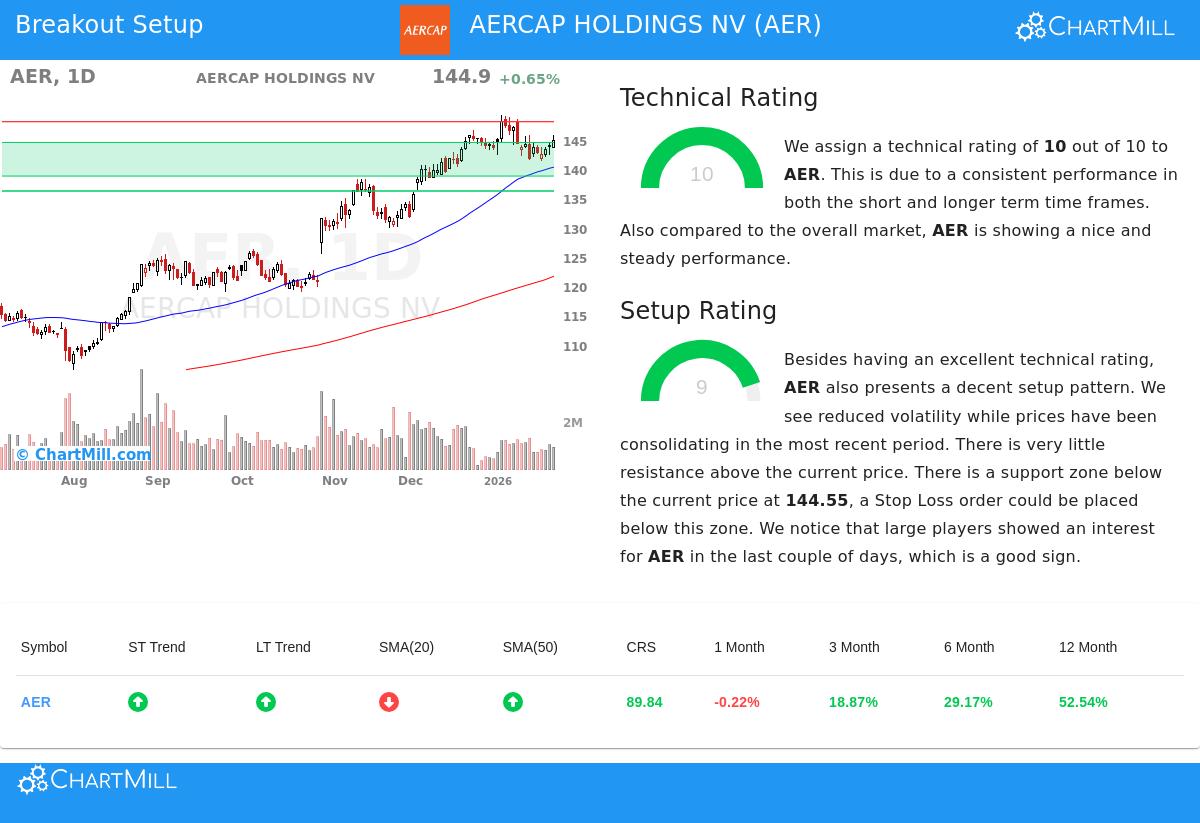
A Base of Technical Health
The main requirement in a breakout search looks for stocks with good underlying momentum, and AerCap does well here. The company has received a complete ChartMill Technical Rating of 10 out of 10. This high score is not given easily; it shows continued health across various time periods and measures.
A look at the full technical report shows the supports of this health:
- Trend Agreement: Both the near-term and longer-term trends for AER are marked as positive. This agreement is a strong sign, showing momentum is favorable across different investment timeframes.
- Relative Performance: The stock is doing better than 89% of the whole market over the last year and 85% of similar companies in the Trading Companies & Distributors industry. This shows it is leading not just in its own price gain but also compared to the wider market and its sector.
- Moving Average Backing: The stock's price is above all its important simple moving averages (20, 50, 100, and 200-day), a clear mark of a healthy upward trend. The fact that the 50, 100, and 200-day averages are all moving up further supports the positive structure.
- Nearness to Highs: AER is trading close to its 52-week high of $149.24. While the S&P 500 is also near highs, AER's ability to stay at this level shows it is taking part in and agreeing with the wider market's health, not falling behind.
This notable technical rating answers the important first question for a momentum investor: "Is this a healthy stock?" For AER, the proof is strongly positive, giving a firm base for any possible trade setup.
A Well-Formed Setup for a Possible Breakout
A strong trend by itself is not a signal to buy; entering after a big jump raises risk. This is where the Setup Quality Rating is key. It finds times of limited trading or a "tight" pattern, which often come before the next price move. AerCap has a Setup Rating of 9, meaning a very good pattern has developed.
The technical report lists the details of this well-formed setup:
- Limited Trading in a Band: Over the last month, AER has traded in a set band between about $141.32 and $149.24. This time of lower movement after a prior rise lets the stock absorb its gains and form a base.
- Clear Support and Resistance: The setup has formed with a clear support area below (between $138.80 and $144.55) and a set resistance level above at $148.10. These levels give clear points for stop-loss placement and breakout confirmation.
- Large Trader Activity: The report mentions more activity from big traders, as seen by the Effective Volume measure. This can be a good sign that knowledgeable money is building during the limited trading phase.
This setup speaks to the second key question: "Is there a good, lower-risk entry point?" The limited trading gives a possible entry near the $148.11 resistance level, with a sensible stop-loss just below the recent band and support area around $141.31. The set band controls the early risk on the trade, a central idea of careful technical investing.
A Complete Picture for Investors
While the technical and setup scores are strong, investors should look at the whole situation. The stock's Average True Range (ATR) of about 1.68% shows a medium amount of daily price movement, which is normal for a stock in its price area. Also, the wider market condition, with the S&P 500's near-term trend positive and longer-term trend neutral, gives a generally helpful background for breakout tries in leading stocks like AER.
It is key to recall that no technical setup assures a win. The noted levels come from recent price movement and can shift with new market data. Always do your own study and think about basic factors, like the company's earnings dates and industry situation, before making any investment choice.
For investors looking for more chances that match this careful breakout model, new choices are found each day. You can see the present list of high-marked technical setups by going to the Technical Breakout Setups screen.
,
Disclaimer: This article is for information only and is not investment advice, a suggestion, or an offer to buy or sell any security. The study is based on technical measures and past data, which are not promises of future results. Investing has risk, including the possible loss of your initial investment. You should do your own research and talk with a qualified financial advisor before making any investment decisions.
