
For investors looking to profit from companies with high growth possibility, a mix of fundamental and technical study can be a useful instrument. The method centers on finding solid growth stocks, companies showing better earnings and sales growth, that are also displaying positive technical formations indicating a possible price rise. This technique tries to match a company's core business strength with good market timing, looking for chances where better fundamentals are starting to be seen in the market's price movement. AUTODESK INC (NASDAQ:ADSK) appears from such a search, offering a situation where sound financial growth meets a tightening technical formation.
Fundamental Growth Driver
At its center, the growth investing idea looks for companies predicted to grow faster than their competitors and the overall market. Autodesk's fundamental report gives numerical proof that it matches this description. The company gets a good Growth Rating of 7/10, supported by sound past results and optimistic future forecasts.
- Past Strength: Over the last year, Autodesk increased its Earnings Per Share (EPS) by 19.20% and Revenue by 15.55%. The longer-term history is even more positive, with an average yearly EPS increase of 24.81% and Revenue increase of 13.37% over recent years.
- Future Forecast: Experts predict this strength to persist, with estimated yearly EPS increase of 17.45% and Revenue increase of 12.21% in the next years. This expected growth is a key part for a growth stock, as it supports investor hope for future value increase.
- Profitability Aids Growth: Outstanding growth is most lasting when paired with high profitability. Autodesk is strong here, having a Profitability Rating of 9/10. Important measures like a Return on Invested Capital (ROIC) of 20.36% and a Gross Margin above 90% show the company effectively turns revenue into profit and maintains a firm competitive stand in its software market.
These fundamental positives are necessary for the method because they find a company with a demonstrated and expected ability for growth, a main idea of growth investing. You can see the full details in Autodesk's fundamental analysis report.
Technical Formation for a Possible Change
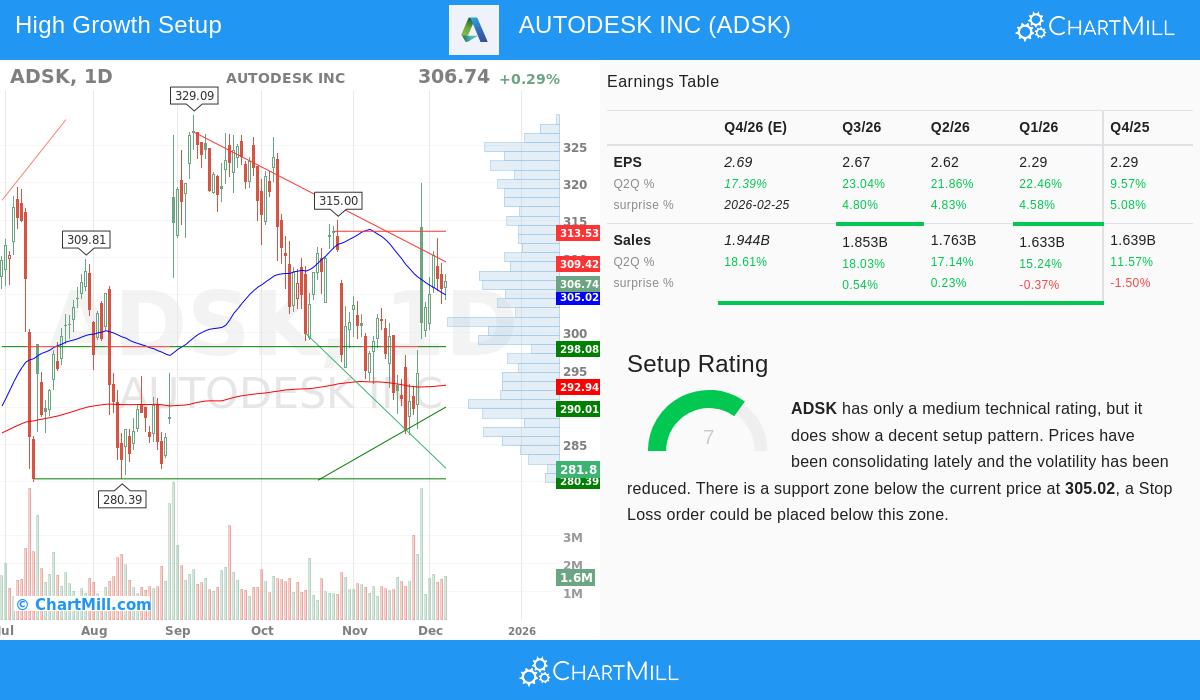
While fundamentals evaluate the "why," technical study looks at the "when" by judging market feeling and price directions. Autodesk's technical view displays a stock that has been moving sideways and could be getting ready for its next price move. The stock gets a Setup Rating of 7/10, which points out bettering conditions on the chart.
- Direction Betterment: The near-term direction has lately become positive, even as the longer-term direction stays neutral. This change hints at growing upward force that might restart the longer-term direction.
- Sideways Movement and Floor: The technical report states that prices have been moving sideways recently, with less price movement. This frequently happens before a notable price change. The stock is now trading above a set floor area from 298.08 to 305.02, a level strengthened by several moving averages and trendlines. In technical method, such a floor area gives a reference point for handling investment risk.
- Ceiling Nearby: For a price rise to be verified, the stock would need to pass the nearby ceiling in the 309.42 to 313.53 area. A continued move above this zone might indicate the start of a new upward stage, matching the technical view with the good fundamental story.
This technical setting is important for the combined method, as it tries to find times when a fundamentally sound stock is changing from a time of pause or gathering into a possible direction-following rise. The full technical evaluation is in Autodesk's technical analysis report.
Valuation and Financial Soundness Points
No study is whole without looking at valuation and balance sheet soundness. Autodesk's Valuation Rating of 5/10 shows a mixed view. While its Price-to-Earnings (P/E) ratio seems high alone, it is fair compared to its software industry competitors and near the wider S&P 500 average. More significantly, its PEG ratio, which includes growth, and its high profitability can support its current valuation for growth-focused investors.
The company's Financial Health Rating of 6/10 presents a detailed view. Autodesk shows very good ability to pay debts, with a strong Altman-Z score and a workable debt level compared to its free cash flow. However, its low current and quick ratios are seen as a small worry. The fundamental report explains this by saying these cash measures must be judged against the details of Autodesk's business model, which includes strong repeating subscription revenue, and that they are balanced by the firm's high profitability and firm ability to pay debts.
Conclusion
Autodesk offers a strong case for investors using a growth-with-technical-formation method. The company shows the numerical signs of a growth stock through very good profitability and a firm history of increasing earnings and sales. At the same time, its chart displays a positive technical position, with a recent good change in near-term force and a sideways pattern above important floor. This combination hints the stock may be matching its market price with its fundamental business path.
For investors wanting to examine other companies that fit similar standards of firm growth combined with encouraging technical formations, more study can be done using the Strong Growth Stock Technical Setups screen.
Disclaimer: This article is for information only and is not financial advice, a suggestion, or an offer or request to buy or sell any securities. The study is based on data and reports thought to be dependable, but its correctness cannot be assured. Investing includes risk, including the possible loss of principal. You should do your own study and talk with a qualified financial advisor before making any investment choices.


