
For investors using charts and price action to inform choices, a methodical process for spotting possible opportunities is important. One technique involves searching for stocks that show both solid technical traits and a favorable price pattern, a pairing that can indicate preparation for a new upward move. This method centers on two specific metrics: the ChartMill Technical Rating, which judges the general condition and direction of a stock, and the ChartMill Setup Quality Rating, which examines if the stock's present price action offers a favorable entry point. By selecting stocks with high marks in both areas, traders try to locate candidates for advancement within the market's notable companies.
Archer-Daniels-Midland Co (NYSE:ADM) recently appeared from such a search, displaying a profile that technical investors may find interesting. As a global agricultural processor and human nutrition provider, ADM's basic business is connected to vital global supply chains. From a chart viewpoint, however, the stock is displaying features that frequently draw momentum and breakout traders.
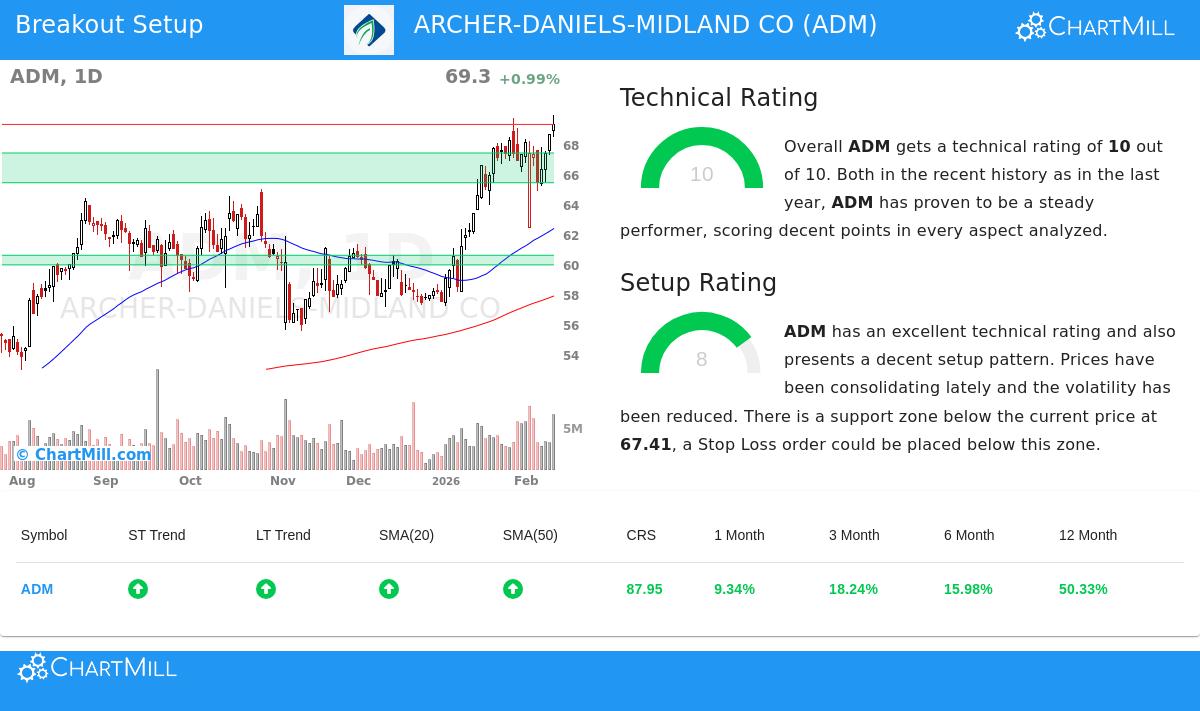
Technical Strength: A Base of Leadership
The heart of this method starts with finding stocks in clear upward movements, as a solid primary trend raises the chance that a breakout will work. ADM's technical picture is very strong, receiving a complete ChartMill Technical Rating of 10. This highest score shows the stock is with the market's top performers from a price trend angle.
An examination of the technical report shows the foundations of this strength:
- Trend Agreement: Both the near-term and longer-term trends for ADM are marked as positive. This agreement across periods is a notable sign of continued buying interest.
- Relative Performance: The stock is doing better than 87% of the whole market over the last year and 89% of similar companies in the Food Products sector. This indicates the rise is not only due to a climbing market but shows particular strength in ADM.
- Moving Average Backing: The stock is priced above all its important moving averages (20, 50, 100, and 200-day), and each of these averages is itself in an upward pattern. This forms a tiered base of support under the price.
- New Highs: ADM is trading close to its 52-week high, a typical trait of top stocks. Reaching new highs confirms the existing upward movement is still in place.
This group of factors meets the first important condition for a breakout setup: confirming the stock is in a solid, confirmed upward movement before looking at an entry.
Setup Quality: Spotting a Tight Coil
A solid trend by itself is not a signal to buy; entering a stock that has just jumped can be hazardous. The second piece of the method looks for a period of settling inside that upward movement—a "tightening" action that may come before the next breakout. ADM's ChartMill Setup Quality Rating of 8 implies it is in such a stage.
The setup examination points to a time of lower volatility and price tightening after a notable rise. Important notes consist of:
- Settling Range: Over the last month, ADM has moved within a set range between about $62.40 and $69.94. It is currently checking the top limit of this range.
- Clear Support and Resistance: The examination notes a main support area between $65.43 and $67.41, made by a combination of trendlines and moving averages. A clear resistance level is near $69.31.
- Risk Clarity: This formation allows for precise trade planning. A possible breakout above resistance could signal the beginning of a new upward push, while the well-marked support area below gives a reasonable place to set a protective stop-loss order.
This setup is important because it answers the "when to buy" question. The settling lets earlier buyers secure gains and new buyers to take positions, possibly forming a base for the next rise if the stock can gather the force to move above its recent peak.
A Possible Trading Plan
From this technical and setup examination, an example trading plan appears. A breakout above the noted resistance near $69.31 could be used as a signal for entry, with a first stop-loss order set below the important support area around $65.42. This sets the trade's possible loss at about 5.6% on the share price. For a portfolio-level method to manage risk, position size can then be changed so that this possible loss stands for a suitable part of total funds.
Find More Possible Breakout Setups
The process that found ADM can be used methodically across the market. For investors looking for an updated list of technical breakout candidates each day, the Technical Breakout Setups screen selects for stocks with a Technical Rating of 7 or more and a Setup Rating of 7 or more, giving a concentrated beginning point for more study.
Disclaimer: This article is for information only and does not form investment guidance, a suggestion, or an offer to buy or sell any security. The examination is based on technical measures and past price information, which are not assurances of future results. Investing carries risk, including the possible loss of original capital. Always perform your own investigation and think about your personal money situation and risk comfort before making any investment choice. The example trade plan is for illustration and is made automatically; it is not a specific suggestion.