
For investors focused on chart patterns and price momentum, a systematic method for finding possible trades can simplify the research process. One such technique uses a scan for stocks that show both good basic technical condition and a clear, usable setup pattern. This plan tries to join the "what" with the "when": first finding stocks in a good uptrend, and then finding moments where they are moving in a narrow band, indicating a possible breakout is close. This two-step method tries to find chances in market leaders at a time when risk can be more plainly set.
Archer-Daniels-Midland Co (NYSE:ADM), a global leader in agricultural processing and human nutrition, recently appeared from such a technical scan. The company's stock presents a noteworthy case for technical investors, as it scores well on both the basic trend strength and the condition of its present consolidation pattern.
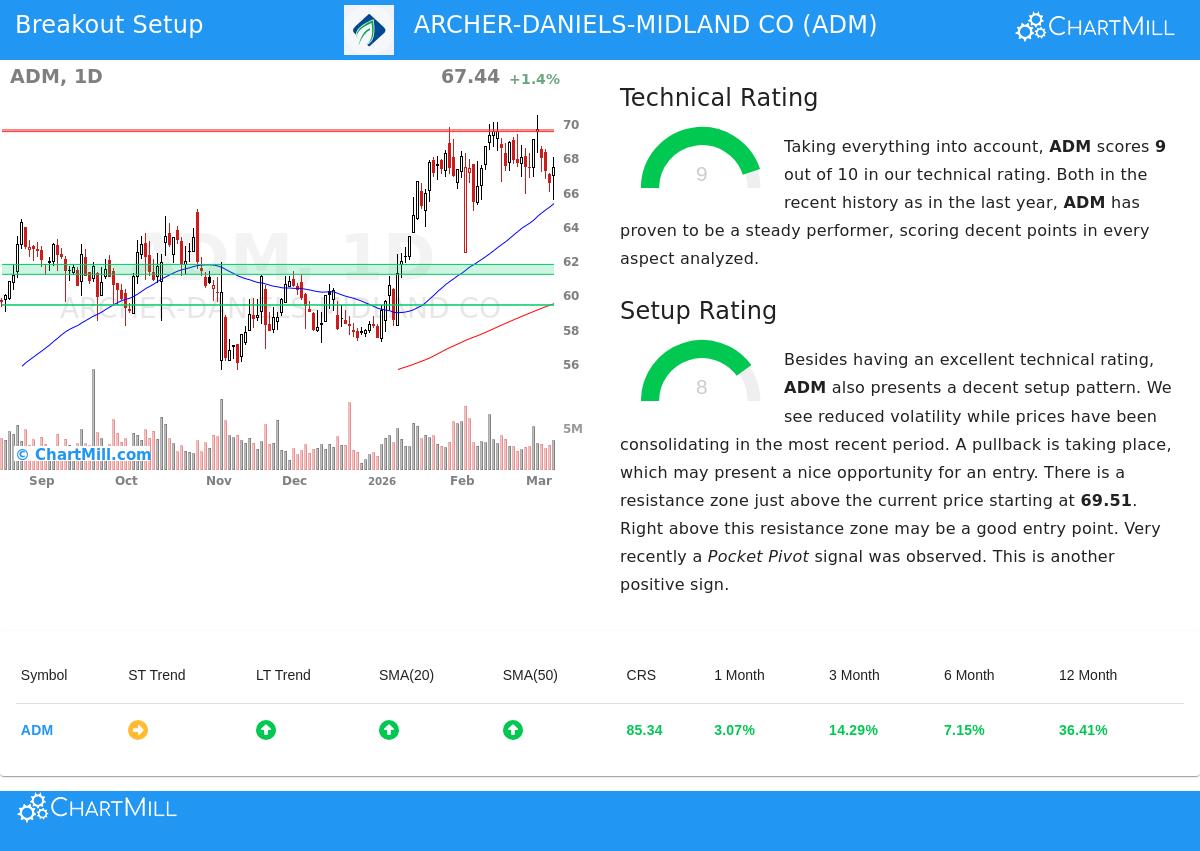
Looking at the Technical Base
The main filter in a breakout plan is to confirm the stock is in a verified uptrend, as buying during weakness often leads to bad outcomes. ADM's technical base is clearly firm, receiving a top ChartMill Technical Rating of 9 out of 10. This number combines multiple timeframes and indicators to measure the stock's total technical condition.
A close look at the full technical report shows the supports of this strength:
- Long-Term Trend Condition: The long-term trend is rated as positive, which is a key background for any breakout play. This is visually confirmed by the stock trading well above its important moving averages (SMA 50, 100, and 200), all of which are rising.
- Relative Strength: ADM is showing better performance not just in the wider market but within its own sector. The report states the stock is doing better than 85% of all stocks in the market and 85% of its peers in the Food Products industry over the last year.
- Sturdy Performance: Even with recent consolidation, the stock stays in the higher part of its 52-week range, matching with the S&P 500 and showing it has kept its bullish position.
This strong technical rating answers the "which stock" question positively, showing ADM is a market leader with momentum on its side, a requirement for the plan.
Judging the Setup Condition
A good trend alone is not a buy signal; entering after a fast rise holds notable risk. The second filter looks for a "when" by finding times of low-volatility consolidation, which often come before the next move higher. ADM does well here also, with a ChartMill Setup Rating of 8 out of 10.
The technical report points out several parts that add to this high setup score:
- Price Consolidation: The stock has been trading in a set band between about $65.22 and $70.48 over the last month. This coiling action, after a prior rise, is a common sign of a possible breakout.
- Clear Support and Resistance: The analysis finds a well-set resistance area between $69.51 and $69.61. A clear move above this area could show the start of a new uptrend phase. On the other hand, multiple support levels are noted below, giving clear places to handle risk.
- Supportive Signs: The report also states the recent appearance of a "Pocket Pivot" signal, a volume-based pattern that suggests buying by larger investors during the consolidation, adding a layer of confirmation to the setup.
This high setup rating shows that ADM is not just trending but is also in a state where a careful entry point with a sensible stop-loss level can be found, meeting the "when" need of the plan.
A Set Possible Trade Setup
From this study, the technical report describes a specific, rules-based situation. It proposes a possible entry on a breakout above the noted resistance, specifically at $69.62, with a stop-loss set below nearby support at $65.49. This sets the trade's risk at about 5.9% on the share price, allowing for exact position sizing. It is a standard example of how the mix of a high technical rating and a high setup rating can turn into a solid, quantifiable trading plan.
Finding Like Chances
The process that highlighted ADM can be used in a set way to find new possible setups each day. By scanning for stocks with good technical ratings and high-condition consolidation patterns, investors can effectively build a watchlist of interesting candidates.
You can view today's full list of technical breakout setups by visiting the Technical Breakout Setups screen.
,
Disclaimer: This article is for information only and does not make up investment advice, a suggestion, or an offer or request to buy or sell any securities. The study is based on technical data and automated scoring models, which can change. All investing and trading involves risk, including the possible loss of principal. Always do your own research, think about your financial position and risk tolerance, and talk with a qualified financial advisor before making any investment choices. The example trade setup described is automated and for illustration; real trading choices should be made from your own independent study.