
Technical breakout trading strategies focus on identifying stocks with strong existing momentum that are consolidating in preparation for their next significant price move. This approach combines two critical elements: a sound technical base indicating the stock is in a sustainable uptrend, and a high-quality setup showing recent price consolidation that suggests an optimal entry point. By screening for securities that show both characteristics at the same time, traders aim to capture moves as stocks break out of their consolidation patterns with renewed momentum.
ARCHER-DANIELS-MIDLAND CO (NYSE:ADM) has come from such a screening process with notable technical credentials. As a global agricultural commodities processor and human nutrition provider, the company's stock is showing characteristics that warrant attention from technically-oriented investors.
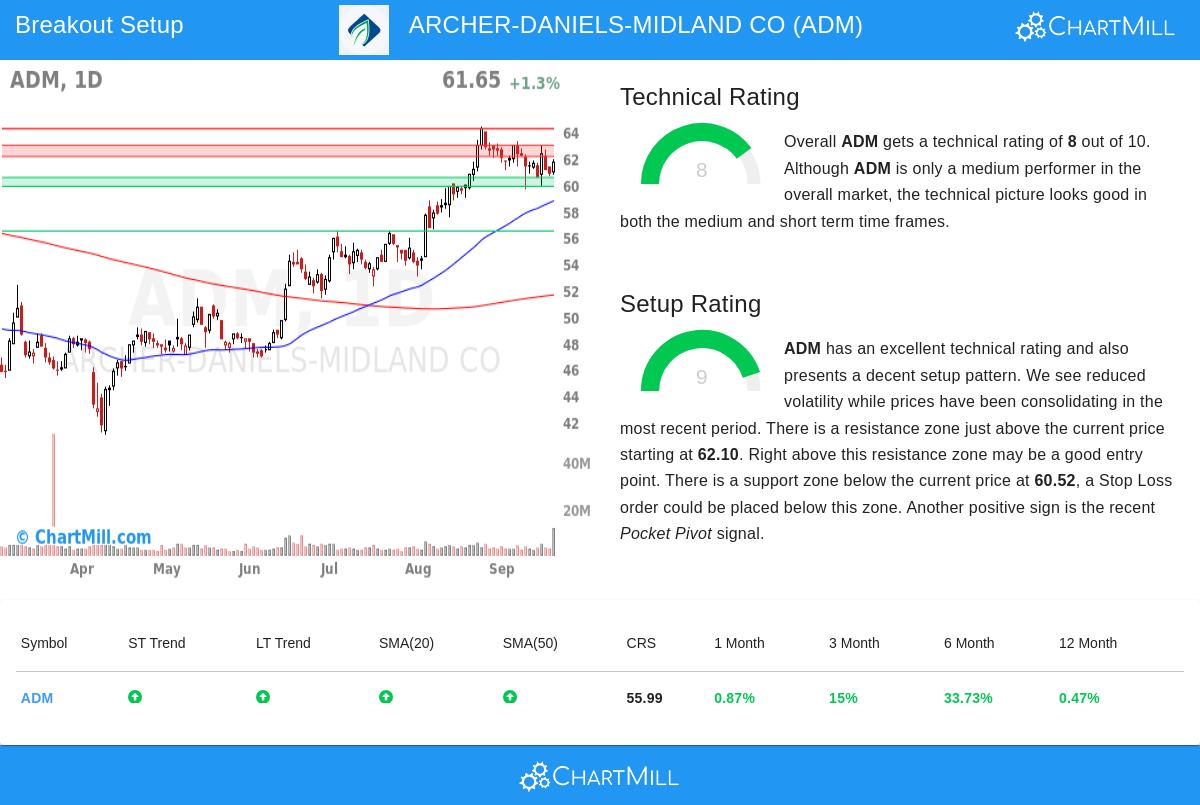
Technical Strength Assessment
ADM shows a firm technical base with a ChartMill Technical Rating of 8 out of 10, indicating strong existing momentum. This rating reflects multiple positive factors that match the breakout strategy's requirement for technically sound stocks:
- Both short-term and long-term trends are positive, confirming alignment across different time horizons
- The stock is trading above all key moving averages (20-day, 50-day, 100-day, and 200-day), with each average trending upward
- Performance metrics show substantial gains across multiple periods:
- 3-month performance: +15.0%
- 6-month performance: +33.7%
- 12-month performance: +0.5% (with recent acceleration)
Within the Food Products industry, ADM performs better than 73% of its 89 peers, showing relative strength that is important for breakout candidates. The stock's ability to maintain position in the upper portion of its 52-week range while showing consistent upward momentum provides the technical base needed for successful breakout trades.
Setup Quality Evaluation
The setup quality represents the consolidation pattern that comes before potential breakouts, and ADM performs well in this area with a Setup Rating of 9 out of 10. This high score indicates the stock has been trading in a tight range recently, creating the consolidation base that breakout strategies look for:
- Recent trading has occurred within the $59.57-$64.38 range, with current prices consolidating in the middle of this range
- Reduced volatility has created conditions favorable for a decisive breakout move
- The presence of a recent Pocket Pivot signal indicates institutional accumulation, adding confidence to the setup
The technical analysis identifies clear support and resistance levels that provide logical points for trade management:
- Primary support zone: $59.84-$60.52 (multiple trend lines on daily timeframe)
- Key resistance zone: $62.10-$62.95 (combining trend lines and moving averages)
Trading Implications
For technical traders, ADM presents a notable opportunity based on the combination of strong underlying trends and high-quality consolidation. The suggested trade setup involves:
- Entry above resistance at $62.96 (buy stop order)
- Stop loss below support at $59.83
- Risk management: 4.97% position risk, suggesting 20.12% capital allocation for 1% portfolio risk
This structure allows traders to participate only if the breakout actually happens, avoiding early entries during continued consolidation. The clear support and resistance levels provide logical points for risk management, which is important for disciplined technical trading.
The current market environment supports such technical setups, with the S&P500 showing positive trends in both short-term and long-term timeframes. This broader market strength provides a favorable background for breakout candidates like ADM to successfully complete their potential moves.
For traders looking for additional technical breakout opportunities, our Technical Breakout Setups Screen provides daily updated results using the same methodology that found ADM's potential.
Disclaimer: This analysis is based on technical indicators and historical price patterns and should not be considered investment advice. The mentioned trade setup is provided for educational purposes only. Always conduct your own research, consider your risk tolerance, and consult with a financial professional before making investment decisions. Past performance is not indicative of future results.