
Technical analysis investors often look for stocks showing both good basic momentum and clear consolidation patterns that indicate possible breakouts. The ChartMill Technical Breakout method assesses securities using two main metrics: the Technical Rating, which checks overall technical condition and trend quality, and the Setup Quality Rating, which finds consolidation patterns with good risk-reward entry levels. Stocks with good scores on both metrics usually show interesting technical formations where solid trends meet possible breakout situations.
Technical Strength Check
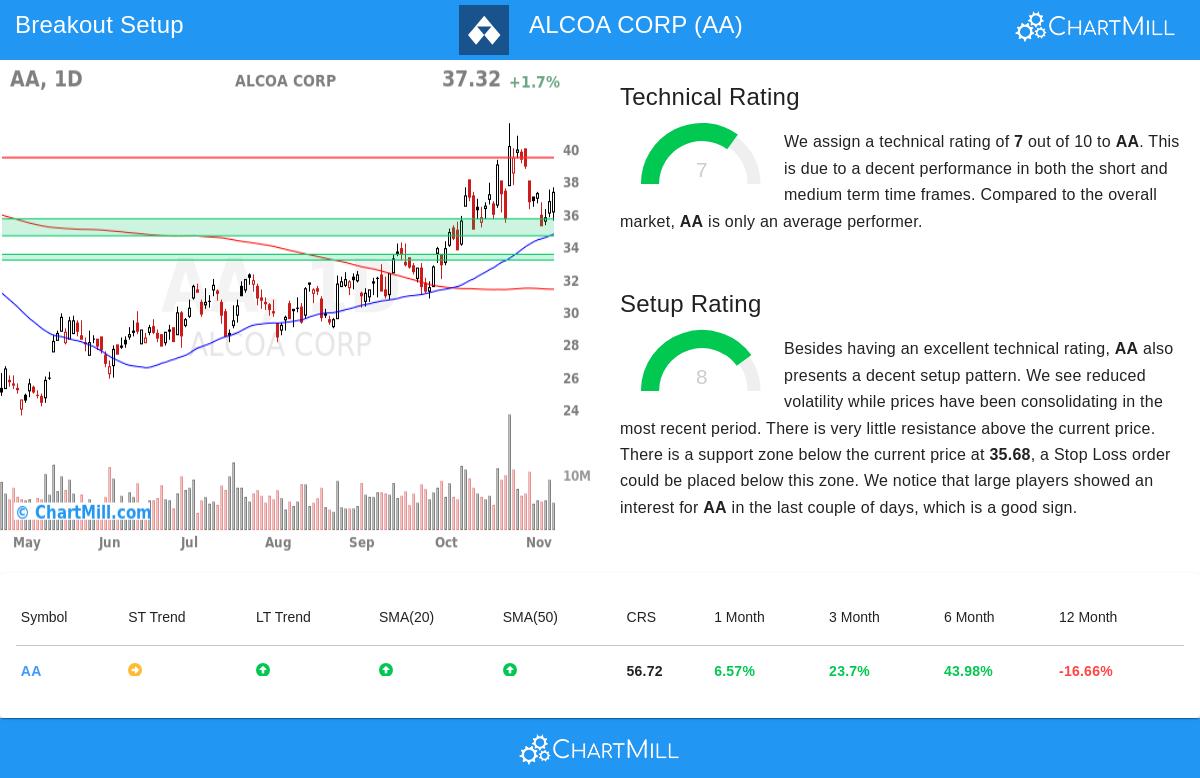
ALCOA CORP (NYSE:AA) gets a good Technical Rating of 7, pointing to positive technical conditions across different time periods. This rating shows the stock's place in the wider market and looks at items like relative performance, trend path, and moving average agreement. The technical check shows a few positive parts:
- The long-term trend is still good, but the short-term trend is mixed, indicating a chance for the trend to keep going
- Price stays above important moving averages (20-day: $37.34, 50-day: $34.74, 100-day: $32.48)
- Six-month performance is good with a 44% gain
- Relative performance puts AA better than 56% of all stocks over the last year
These technical features are important because the Breakout method looks for stocks with existing upward momentum. Securities with Technical Ratings of 7 or more usually show the trend staying power needed for good breakout trades, as they have already shown they can keep moving up even when the market changes.
Setup Quality Check
Besides technical strength, AA shows an interesting setup pattern with a Setup Quality Rating of 8. This high score means the stock has been moving in a set range while price swings have lessened, conditions that frequently come before notable price changes. The setup check shows a few positive features:
- Prices have been moving between $35.13 and $41.55 over the last month, making clear borders
- Lowered price swings set the stage for a possible large move
- A clear support area is found between $34.63 and $35.68, giving a sensible place for stop-loss orders
- Big investors have shown more activity in recent days, as seen by the Effective Volume indicator
The value of setup quality is its use in finding the best entry time. While technical strength shows what to buy, setup quality shows when to buy. High Setup Ratings usually happen when stocks stop moving within existing trends, letting investors enter with clear risk limits before the next possible price increase.
Trade Structure Points
The technical analysis indicates a possible trade setup with entry at $39.44, placed just above the current resistance, and exit at $35.21, placed under the set support area. This plan would mean:
- A risk of about 10.7% on the trade
- Position size of about 9.3% of capital for 1% portfolio risk
- Clear technical reason with entry above resistance and exit below support
For investors using this method, the mix of AA's technical rating and setup quality makes a good case for watching. The stock shows both the basic strength and consolidation pattern that technical breakout strategies aim to find.
Finding Other Possibilities
The Technical Breakout screen that found ALCOA CORP updates every day with new possible setups. Investors can see current breakout options to find other stocks showing similar technical features. For a full look at AA's technical situation, see the full technical report.
Disclaimer: This analysis is based on technical indicators and historical performance and should not be considered investment advice. Always conduct your own research, consider your risk tolerance, and consult with a financial advisor before making investment decisions. Technical trading involves substantial risk of loss and is not suitable for all investors.