
Technical breakout investing focuses on identifying stocks with strong momentum that are consolidating before their next upward move. Traders look for stocks with solid technical health and tight price action, signaling a potential breakout. EBAY Inc (NASDAQ:EBAY) currently fits this profile, displaying a high technical rating and a favorable setup pattern.
Technical Strength and Setup Quality
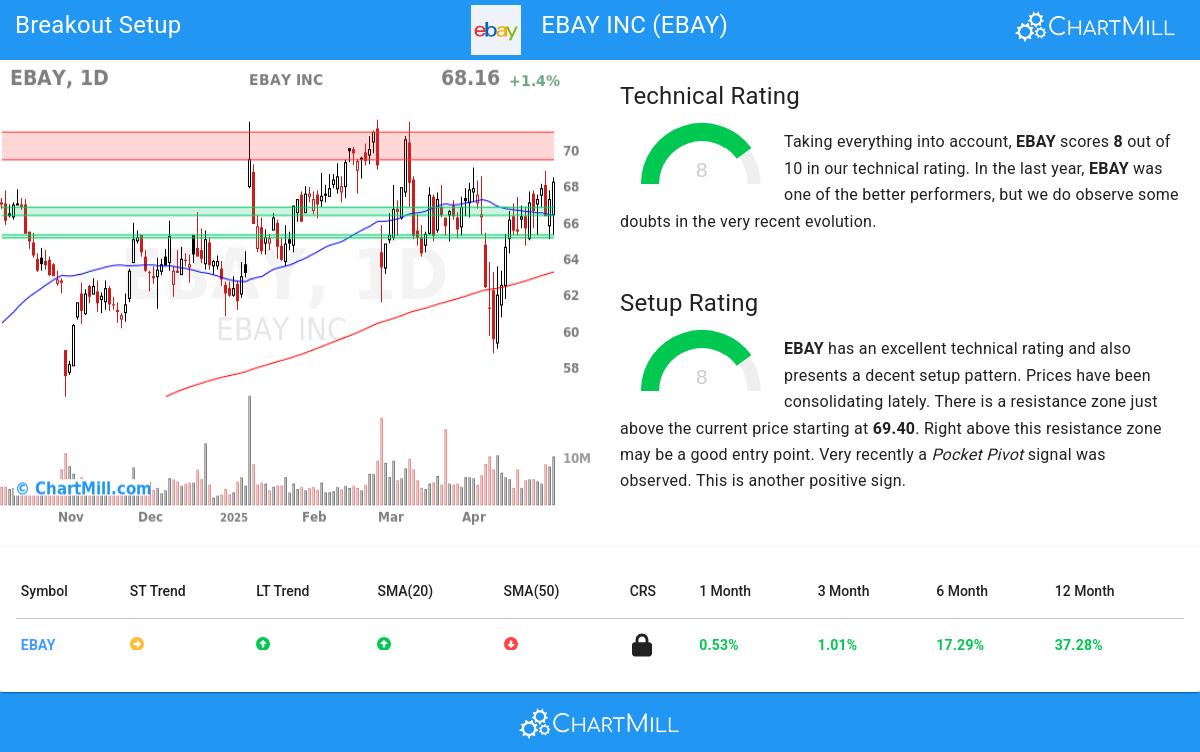
EBAY has a Technical Rating of 8 and a Setup Rating of 8, indicating both strong momentum and a well-defined consolidation pattern. The stock’s long-term trend remains positive, while the short-term trend is neutral, suggesting a potential continuation of upward movement after a period of stability.
Key highlights from the technical analysis report:
- Relative Strength: EBAY outperforms 90% of all stocks over the past year.
- Support Levels: Multiple support zones exist between $59.52 and $66.78, providing a cushion against downside risk.
- Resistance: A key resistance area lies between $69.40 and $70.93. A breakout above this zone could signal further upside.
- Volume: The stock maintains healthy liquidity, with an average daily volume of 6.27 million shares.
Breakout Setup
The stock has been consolidating within a range of $58.71 to $68.80 over the past month, currently trading near the upper end. A breakout above $70.94 (just above resistance) could serve as an entry point, with a stop-loss placed below support at $66.32. This setup offers a favorable risk-reward ratio, with a potential loss of 6.51% if the trade moves against expectations.
For traders seeking additional breakout candidates, more results can be found here.