
Technical breakout investing focuses on identifying stocks with strong momentum and consolidation patterns, offering favorable entry points. Abbott Laboratories (NYSE:ABT) currently presents a compelling case for traders looking for such opportunities.
Technical Strength and Setup
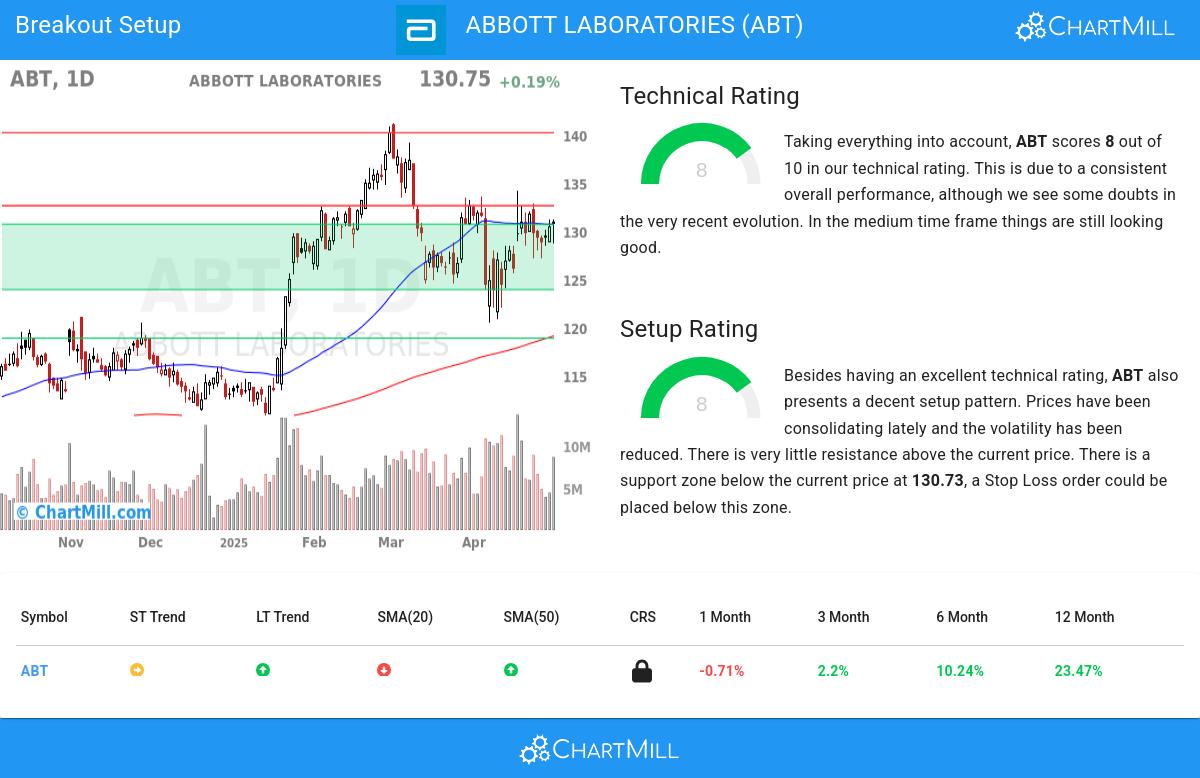
Abbott Laboratories (NYSE:ABT) has a Technical Rating of 8, indicating a solid uptrend with healthy momentum. The stock outperforms 87% of its peers in the Health Care Equipment & Supplies sector and remains in the upper range of its 52-week high. While the short-term trend is neutral, the long-term outlook remains positive.
The Setup Rating of 8 suggests a well-defined consolidation pattern. Recent price action has shown reduced volatility, with support near $130.73 and resistance at $132.65. A breakout above this resistance could signal further upside.
Key Support and Resistance Levels
- Support Zones:
- $123.94 - $130.73 (multiple moving averages & trendlines)
- $118.89 (weekly trendline)
- Resistance Levels:
- $132.65 (daily horizontal line)
- $140.23 (next key resistance)
A potential trade setup suggests an entry at $132.66, with a stop loss below $127.12, representing a 4.18% risk.
For more details, see the full Technical Analysis Report.
Why This Setup Stands Out
- Strong Relative Strength: ABT has outperformed 87% of stocks over the past year.
- Consolidation Pattern: Reduced volatility and tight trading range indicate a potential breakout.
- Liquidity: Average daily volume of 7.4 million shares ensures smooth execution.
For additional breakout candidates, check the Technical Breakout Screen.