
For investors using technical analysis to find possible opportunities, a disciplined screening process is important. One useful method involves filtering for stocks that are both technically sound and forming a constructive price pattern. This approach, often called a "technical breakout" strategy, aims to find market leaders that are consolidating after an advance, preparing for a possible continuation of the trend. The objective is to merge a stock's existing momentum with a clear, low-risk entry point.
ZIONS BANCORP NA (NASDAQ:ZION) recently appeared from such a screen, suggesting it may deserve closer examination from technically-oriented investors. The bank holding company, which operates across several western U.S. states, appears to be showing the two characteristics this strategy looks for: sound technical health and a high-quality setup pattern.
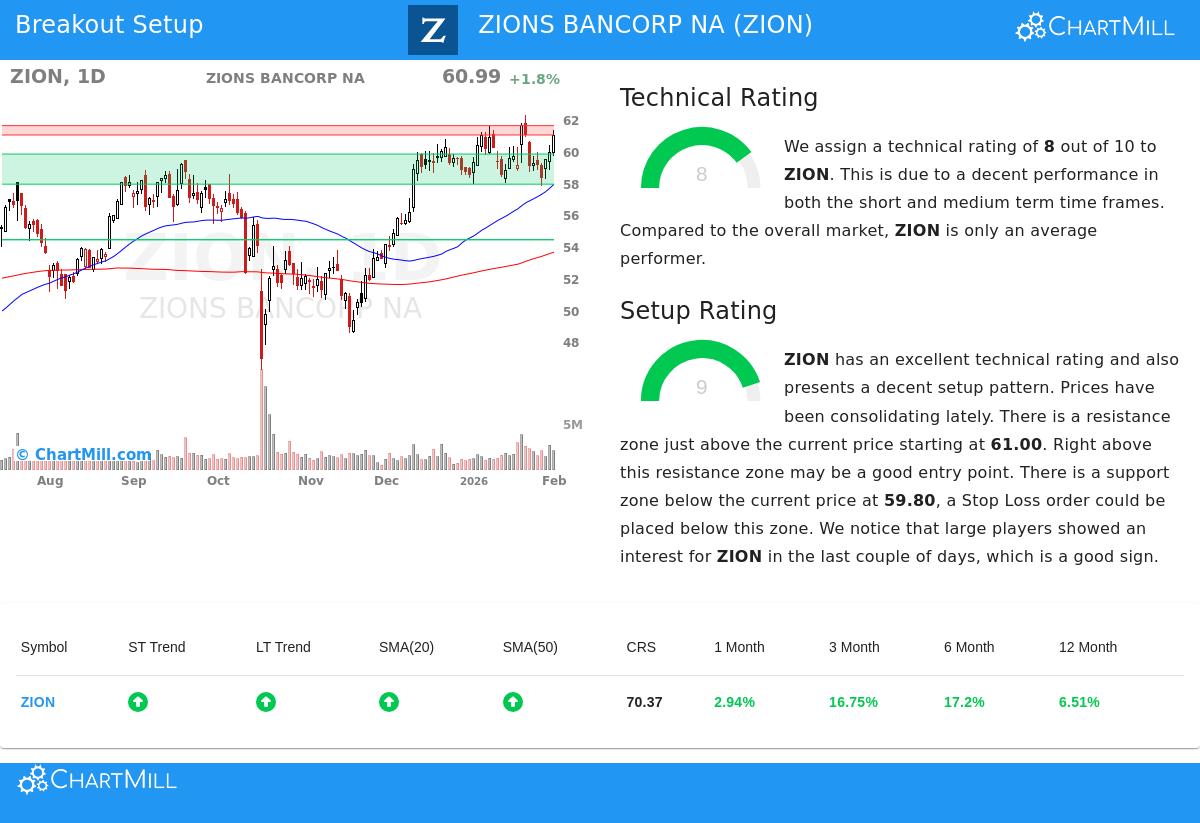
Assessing the Technical Foundation
The first part of this strategy is finding stocks with sound underlying technicals, showing sustained buying pressure and a positive trend. According to the detailed technical report for ZION, the stock gets a solid Technical Rating of 8 out of 10. This score shows strength across multiple timeframes and metrics.
- Trend Alignment: Both the long-term and short-term trends for ZION are rated as positive. This alignment is a constructive sign, suggesting momentum is not just a short-term event but part of a larger upward move.
- Moving Average Support: The stock is trading above all its key simple moving averages (20, 50, 100, and 200-day), and each of these averages is itself in a rising configuration. This stacked alignment of support levels is a classic sign of a healthy uptrend.
- Relative Performance: ZION is currently trading near its 52-week high, a sign of strength, especially when compared against the broader market's more range-bound action over the past year. The report notes the stock performs better than 70% of the market on a yearly basis.
This mix of factors supports the high technical rating. For a breakout strategy, beginning with a stock that is already in a confirmed uptrend raises the chance that a breakout from consolidation will lead to more gains, rather than failing against overhead resistance.
Evaluating the Setup Quality
A strong trend alone is not a signal to buy, entering at a high price can lead to quick pullbacks. The second important filter is the Setup Quality Rating, which measures whether the stock is forming a coherent pattern that offers a clear, defined trade. ZION scores an excellent 9 out of 10 on this metric.
The report indicates prices have been consolidating lately, which is exactly what the setup rating looks to find. This consolidation has created defined boundaries that technical traders can use to manage risk.
- Resistance Zone: A clear resistance area is identified between $61.00 and $61.59. A decisive move above this zone could signal the restart of the uptrend and serve as a possible entry trigger.
- Support Zone: Below the current price, a significant support zone exists from $57.90 to $59.80, formed by a mix of moving averages and trendlines. This gives a logical area to place a protective stop-loss order, defining the maximum acceptable risk on the trade.
- Institutional Interest: An additional positive note is that the report found interest from large players in recent days, as measured by volume analysis. This can be a confirming factor that the stock is on the radar of bigger money.
The high setup score confirms that ZION is not just trending, it is pausing in an organized way. This pause builds energy and creates the "spring" or "base" from which a new leg higher can begin, offering a strategic moment for consideration.
A Sample Trading Framework
Based on this analysis, the technical report suggests a sample framework. It proposes an entry order at $61.60, placed just above the identified resistance zone to confirm buyer conviction. A stop-loss order at $57.76, placed below the support zone, would limit the possible loss to approximately 6.2% on the trade. It is important to remember that this is an illustrative example created from the technical parameters. Every investor must adjust their entry, exit, and position size to their individual risk tolerance and overall strategy.
Finding Similar Opportunities
ZIONS BANCORP NA presents a case study in how merging a sound technical rating with a high-quality setup can highlight possible breakout candidates. For investors interested in scanning the market for similar configurations, this methodology is applied daily in the Technical Breakout Setups screen.
Disclaimer: This article is for informational purposes only and does not constitute investment advice, a recommendation, or an offer to buy or sell any security. The analysis is based on technical data and automated scoring models. Investors should conduct their own research, consider their financial situation and risk tolerance, and consult with a qualified financial advisor before making any investment decisions. Past performance is not indicative of future results.