
The process of identifying stocks positioned for major growth often involves a mix of strict technical and fundamental analysis. One organized method that represents this thinking is the strategy made famous by trader Mark Minervini. His system, focused on the Specific Entry Point Analysis (SEPA), aims to locate stocks showing powerful uptrends, improving fundamentals, and definite catalysts shortly before they make large price gains. A primary early filter in this process is the Minervini Trend Template, a group of technical rules created to confirm a stock is in an established, strong uptrend. For investors looking for high-growth chances, this technical base is then paired with a review of a company's earnings and sales momentum. By using a "High Growth Momentum + Trend Template" screen, investors can methodically search for securities that have both the correct chart pattern and the essential business growth to possibly support a large rise.
Yatra Online Inc (NASDAQ:YTRA) functions as a top corporate and leisure travel platform in India, offering air ticketing, hotel bookings, and other travel-related services to a large customer group. The company's recent operational and financial results has drawn the notice of growth-oriented investors using structured screening methods.
Reviewing the Technical Base: The Minervini Trend Template
A central idea of the Minervini strategy is to invest following a confirmed trend, steering clear of the problems of trying to buy a declining stock. The Trend Template gives a clear, rules-based structure to find stocks in a Stage 2 advance, where most of a stock's large price gains usually happen. For Yatra Online, a check of the main technical points shows a strong fit with this template.
- Moving Average Arrangement: The stock's price is above all its main simple moving averages (SMAs), a key need. Importantly, these averages are ordered in the proper bullish order: the shorter 50-day SMA ($1.61) is above the 150-day SMA ($1.27), which is above the longer 200-day SMA ($1.15). Also, the 200-day SMA is increasing, confirming a positive long-term trend.
- Nearness to Highs: Minervini stresses concentrating on strength, not low price. YTRA's present price is about 219% above its 52-week low of $0.58, showing major recovery and momentum. At the same time, it is trading within 7.5% of its 52-week high of $2.00, showing it is acting as a market leader.
- Relative Strength: Leadership is critical. YTRA has a ChartMill Relative Strength (CRS) score of 87.31, meaning it is performing better than 87% of all stocks. More significantly, inside its Hotels, Restaurants & Leisure industry, it performs better than 95% of its 131 competitors. This high relative strength is a sign of stocks expected to keep leading during market uptrends.
This combination of factors leads to a solid ChartMill Technical Rating of 9 out of 10 for YTRA, highlighting its very good technical condition and fit with the trend-following ideas of the Minervini strategy.
Examining the Growth Driver: High Growth Momentum
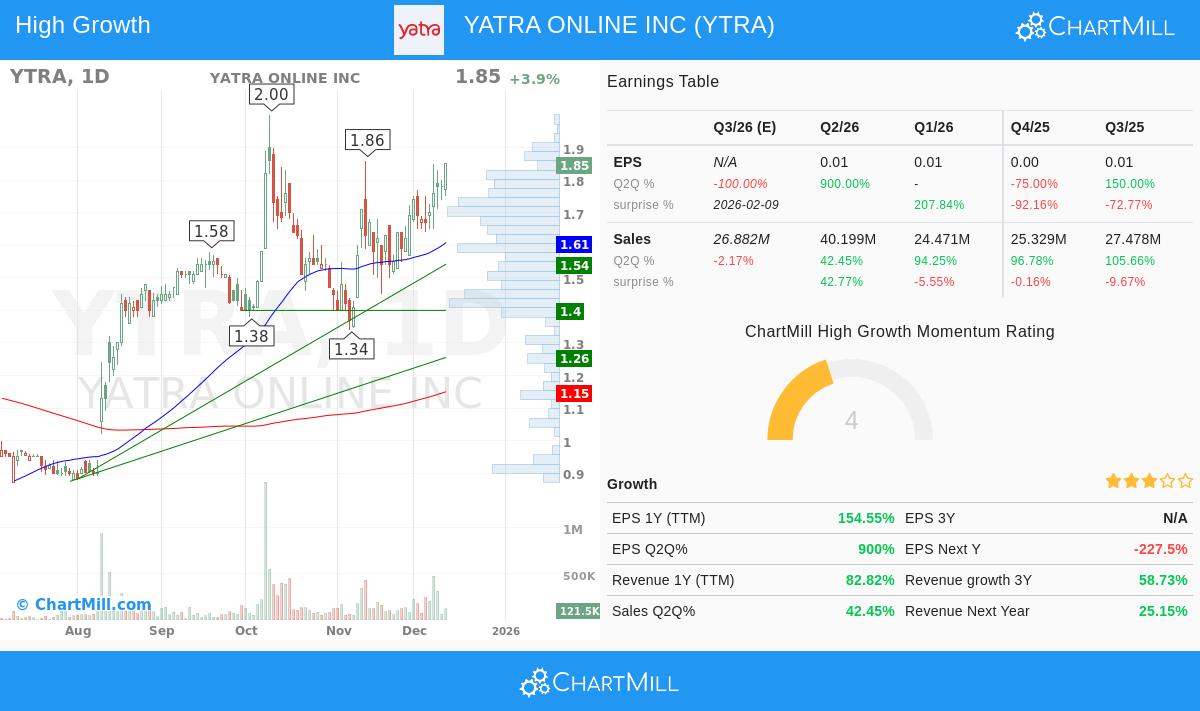
While a good chart is necessary, the Minervini idea states that the largest stock winners are nearly always backed by strong fundamental growth. This is where the "High Growth Momentum" part of the screen becomes important. It looks for companies displaying not only growth, but speeding growth in main financial measures, a possible sign of a fundamental catalyst and growing business momentum. Yatra Online's recent financial reports show several of these high-growth traits.
- Major Earnings Growth: The company has reported very large year-over-year earnings per share (EPS) growth. The latest quarter showed a gain of 900%, after a 150% gain in the quarter three periods before. While quarterly results can change, the trailing twelve-month (TTM) EPS growth is at a notable 154.5%.
- Powerful and Speeding Revenue: Revenue growth gives a wider view of business expansion. YTRA's TTM revenue has increased by 82.8%. Recent quarterly sales growth has been consistently strong, with numbers of 42.5%, 99.7%, and 113.7% over the last three reported quarters, pointing to continued demand.
- Analyst Positive View on Future Sales: A main sign of continued momentum is higher changes in future estimates. Analysts have raised their average revenue estimate for the next fiscal year by 9.4% over the past three months, showing more belief in the company's sales path.
- Gaining Profitability: The company's profit margin in the last reported quarter was 1.37%, showing a gain from 0.21% three quarters ago. This move toward profitability on a per-transaction basis is a positive fundamental change for a growth company.
Present Market Environment and Setup Quality
The wider market condition, shown by a positive short and long-term trend for the S&P 500, gives a helpful background for trending strategies. However, a full review needs looking at the immediate trading setup. According to the given technical analysis report, while YTRA's technical condition is very good, its present Setup Quality score is lower. The report states that "price movement has been a little bit too volatile to find a nice entry and exit point" and proposes it "may be a good idea to wait for a consolidation first." This points out a key step in the Minervini process: screening finds candidates, but manual chart review decides the exact, low-risk entry point, often after a volatility contraction pattern (VCP).
Summary and Following Actions
In summary, Yatra Online Inc presents a situation where a strict screening process has found a stock that fits both the technical rules of the Minervini Trend Template and the fundamental push looked for by high-growth investors. The stock is in a confirmed uptrend, displaying market-leading relative strength, and is supported by major recent growth in earnings and sales. The full technical report for YTRA gives more detailed view into support levels and trend features.
For investors wanting to find other companies that meet this mix of strong trend and high-growth momentum, the screening process that found YTRA can be repeated. You can look for more possible candidates by using the High Growth Momentum + Trend Template screen on ChartMill.
Disclaimer: This article is for informational and educational purposes only. It is not intended as investment advice, a recommendation, or an offer to buy or sell any security. The analysis is based on data provided and screening methodologies described, which have inherent limitations. Investors should conduct their own thorough research, consider their financial situation and risk tolerance, and consult with a qualified financial advisor before making any investment decisions. Past performance is not indicative of future results.