
For growth-minded investors, high revenue and EPS growth are key criteria. Today, we'll examine whether BLOCK INC (NYSE:XYZ) fits the bill for growth investing, particularly as it forms a base and hints at a potential breakout. Remember, due diligence is essential, but BLOCK INC has caught our attention on our screen for growth with base formation. It may warrant additional investigation.
Growth Insights: XYZ
ChartMill assigns a Growth Rating to every stock. This score ranges from 0 to 10 and evaluates the different growth aspects like EPS and Revenue, both in the past as in the future. XYZ scores a 8 out of 10:
- The Earnings Per Share has grown by an impressive 88.27% over the past year.
- Measured over the past years, XYZ shows a very strong growth in Earnings Per Share. The EPS has been growing by 33.32% on average per year.
- XYZ shows quite a strong growth in Revenue. In the last year, the Revenue has grown by 10.06%.
- The Revenue has been growing by 38.62% on average over the past years. This is a very strong growth!
- The Earnings Per Share is expected to grow by 22.41% on average over the next years. This is a very strong growth
- XYZ is expected to show quite a strong growth in Revenue. In the coming years, the Revenue will grow by 10.16% yearly.
ChartMill's Evaluation of Health
ChartMill utilizes a Health Rating to assess stocks, scoring them on a scale of 0 to 10. This rating takes into account a variety of liquidity and solvency ratios, both in absolute terms and in comparison to industry peers. XYZ has earned a 6 out of 10:
- XYZ has a Altman-Z score of 2.65. This is amongst the best in the industry. XYZ outperforms 82.18% of its industry peers.
- XYZ's Debt to FCF ratio of 4.88 is fine compared to the rest of the industry. XYZ outperforms 66.34% of its industry peers.
- XYZ has a Debt/Equity ratio of 0.30. This is a healthy value indicating a solid balance between debt and equity.
- With a decent Debt to Equity ratio value of 0.30, XYZ is doing good in the industry, outperforming 62.38% of the companies in the same industry.
- XYZ has a Current Ratio of 2.33. This indicates that XYZ is financially healthy and has no problem in meeting its short term obligations.
- XYZ has a Current ratio of 2.33. This is in the better half of the industry: XYZ outperforms 79.21% of its industry peers.
- XYZ has a Quick Ratio of 2.33. This indicates that XYZ is financially healthy and has no problem in meeting its short term obligations.
- Looking at the Quick ratio, with a value of 2.33, XYZ belongs to the top of the industry, outperforming 81.19% of the companies in the same industry.
What does the Profitability looks like for XYZ
Discover ChartMill's exclusive Profitability Rating, a proprietary metric that assesses stocks on a scale of 0 to 10. It takes into consideration various profitability ratios and margins, both in absolute terms and relative to industry peers. Notably, XYZ has achieved a 5:
- The Return On Assets of XYZ (7.88%) is better than 88.12% of its industry peers.
- XYZ's Return On Equity of 13.62% is fine compared to the rest of the industry. XYZ outperforms 63.37% of its industry peers.
- XYZ has a Return On Invested Capital of 4.72%. This is in the better half of the industry: XYZ outperforms 66.34% of its industry peers.
- In the last couple of years the Profit Margin of XYZ has grown nicely.
- XYZ's Operating Margin has improved in the last couple of years.
How do we evaluate the setup for XYZ?
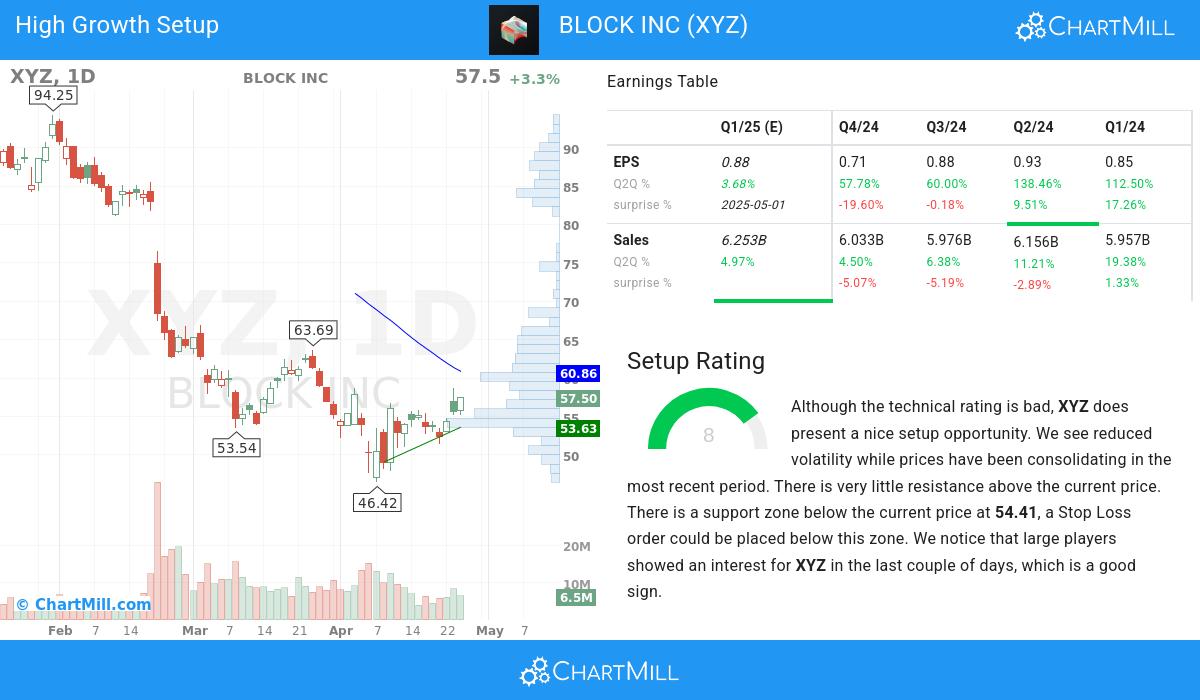
ChartMill provides a Setup Rating for each stock. This rating, ranging from 0 to 10, assesses the level of consolidation in the stock based on multiple short-term technical indicators. Currently, XYZ has a 8 as its setup rating, indicating its current consolidation status.
Although the technical rating is bad, XYZ does present a nice setup opportunity. Prices have been consolidating lately and the volatility has been reduced. There is very little resistance above the current price. There is a support zone below the current price at 54.41, a Stop Loss order could be placed below this zone. We notice that large players showed an interest for XYZ in the last couple of days, which is a good sign.
More Strong Growth stocks can be found in our Strong Growth screener.
For an up to date full fundamental analysis you can check the fundamental report of XYZ
Our latest full technical report of XYZ contains the most current technical analsysis.
Disclaimer
This is not investing advice! The article highlights some of the observations at the time of writing, but you should always make your own analysis and invest based on your own insights.