
Investors looking to find high-potential growth stocks frequently use systematic methods that mix technical strength with fundamental momentum. One method is promoted by well-known trader Mark Minervini, whose strategy depends on a two-step process. First, stocks must meet his strict Trend Template, a group of technical rules meant to find securities in strong, confirmed uptrends. Second, they should show solid and improving fundamental growth, a sign of the major "superperformance" he targets. This approach tries to find leaders early in their large price increases by confirming they are both technically healthy and fundamentally strong.
Xometry Inc-A (NASDAQ:XMTR) recently came from a screen built on this idea, which uses Minervini's Trend Template and adds a high growth momentum filter. We will look at why this manufacturing solutions company seems to match the standards wanted by growth-focused investors.
Technical Match with the Minervini Trend Template
The center of Minervini's technical screening is the Trend Template, an eight-point list that confirms a stock is in a clear Stage 2 uptrend. XMTR's present chart and numbers show a good match with these rules:
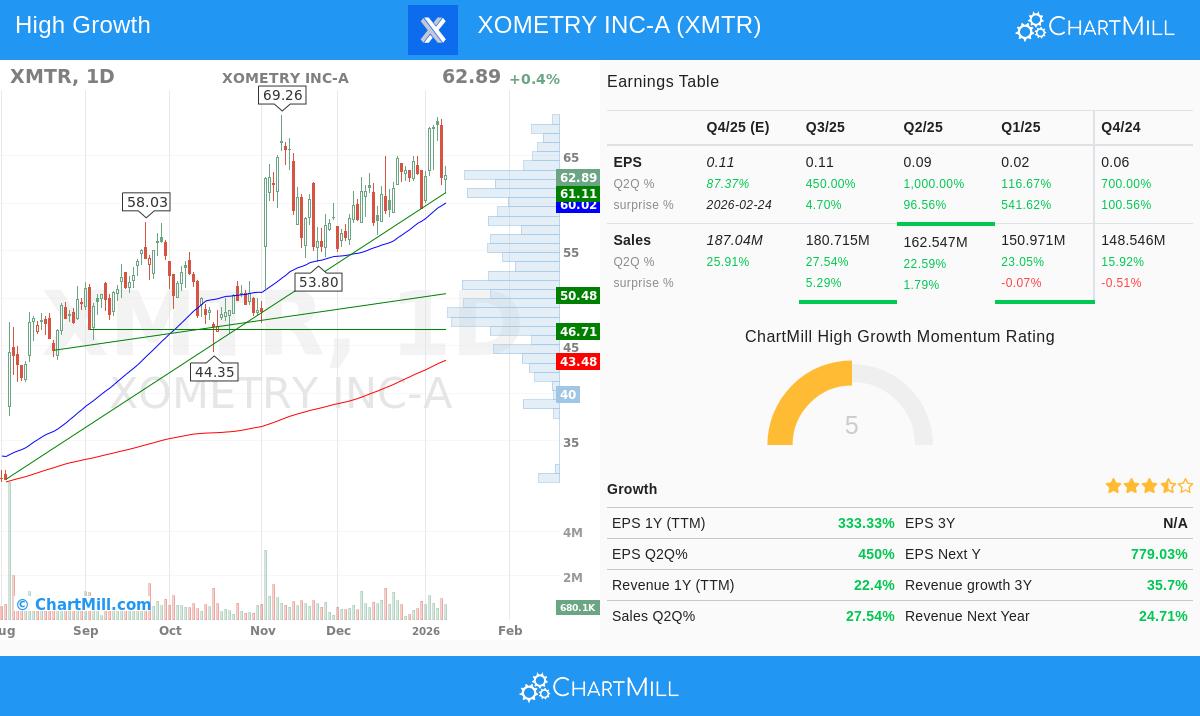
- Price Above Key Moving Averages: The stock's last price of $62.89 trades well above its rising 50-day ($60.02), 150-day ($48.70), and 200-day ($43.48) simple moving averages (SMAs). This meets the template's first three rules, confirming the price is in a positive long-term trend.
- Moving Average Order: The 50-day SMA is above both the 150-day and 200-day SMAs, and the 150-day SMA is above the 200-day SMA. This "stacked" and rising order of averages points to building momentum across several timeframes, a main positive signal in the Minervini method.
- Nearness to Highs: A stock trading close to its 52-week high often shows leadership and good momentum. XMTR's current price is within 10% of its 52-week high of $69.26, easily inside the template's need to be within 25% of the high. At the same time, the price is over 238% above its 52-week low of $18.59, much higher than the 30% minimum level, which points to a strong recovery and growth trend.
- Better Relative Strength: Minervini focuses on investing in market leaders. XMTR has a ChartMill Relative Strength (CRS) rating of 93.72, meaning it has done better than about 94% of all stocks over the past year. This high relative strength is important, as it shows the stock is not just going up but is doing so with more force than the wider market.
This technical view indicates XMTR is in a confirmed uptrend with good institutional support, meeting the exact conditions Minervini uses to find stocks with a greater chance of continued progress.
Fundamental Momentum for Growth Investors
While the Trend Template finds the "when," Minervini's strategy is also focused on the "why." The second filter used in the screen—a High Growth Momentum (HGM) rating—looks for companies showing fast fundamental improvement, often a sign of major price change. Xometry's recent financial numbers show this type of building momentum:
- Earnings Growth Building: The most notable numbers are in earnings per share (EPS) growth. On a trailing twelve-month (TTM) basis, EPS has grown by a notable 333%. More importantly, this growth is building quickly on a quarterly basis, a trend Minervini looks for:
- Last Quarter (Q2Q): +450%
- Previous Quarter (Q-1): +1000%
- Quarter Before That (Q-2): +116.7%
- Steady Earnings Surprises: The company has exceeded analyst EPS estimates in each of the last four quarters, with an average surprise of over 185%. This steady outperformance builds trust and can draw more institutional interest.
- Solid and Consistent Revenue Growth: Top-line growth provides the base. Xometry has delivered year-over-year revenue growth of 22.4% on a TTM basis, with recent quarterly growth numbers staying firm between 22% and 27%. Analysts have also raised their next-year revenue estimates by 3% over the last three months, showing growing confidence.
- Sector Leadership: Inside the Trading Companies & Distributors industry, Xometry's technical rating shows it is doing better than 95% of its peers. This sector-relative strength is another point of confirmation that the company is a leader in its field.
This mix of fast, building profitability on top of good revenue growth is exactly what high-growth momentum screens try to find. It indicates the company is progressing past a pure growth-at-all-costs model toward scalable profitability, a shift that can be very positive for investors.
Technical Condition and Setup Review
Beyond the specific Trend Template rules, a wider view of Xometry's technical condition is positive. ChartMill's own Technical Rating for XMTR is a good 9 out of 10, placing it among the top-level stocks from a technical view. The long-term trend is rated as positive, and the stock is trading in the higher part of its 52-week range.
The analysis also notes a fair Setup Rating of 7. This indicates the stock has been settling recently inside a range, possibly preparing for its next move. The technical report finds several support areas below the current price, which can help set risk levels. A recent "Pocket Pivot" signal—a volume-based sign suggesting buying—adds another positive point to the setup.
For a full look at the support levels, trend study, and a sample trade setup based on this technical view, you can see the complete ChartMill Technical Report for XMTR.
Finding Like Opportunities
Xometry Inc-A offers an example of how combining Minervini's trend-following method and a focus on fundamental building can find possible growth candidates. Its chart displays the signs of a Stage 2 uptrend, while its financials show the type of fast earnings growth that supports continued rallies.
For investors looking to search for other stocks that meet this mix of technical and fundamental standards, the ready-made screen that found XMTR is ready to use. You can find more possible candidates by using the High Growth Momentum + Trend Template screen on ChartMill.
Disclaimer: This article is for informational and educational purposes only. It is not intended as investment advice, nor does it constitute a recommendation to buy, sell, or hold any security. The analysis is based on data provided and certain methodologies, but past performance is not indicative of future results. Always conduct your own due diligence and consider consulting with a qualified financial advisor before making any investment decisions. Please read our full disclaimer here.