
Xometry Inc-A (NASDAQ:XMTR) has been recognized as a potential option for investors using Mark Minervini’s momentum-focused trading approach, which blends technical performance with strong growth fundamentals. The stock aligns with Minervini’s Trend Template, confirming it is in a solid upward trend while also displaying the earnings and revenue growth traits favored by growth-oriented investors. This strategy targets stocks with improving fundamentals, notable relative performance, and positive technical patterns, key elements of Minervini’s framework for spotting leading market performers.
Why XMTR Matches the Minervini Trend Template
Minervini’s Trend Template helps identify stocks in a clear upward trend with solid momentum. XMTR satisfies several important technical conditions:
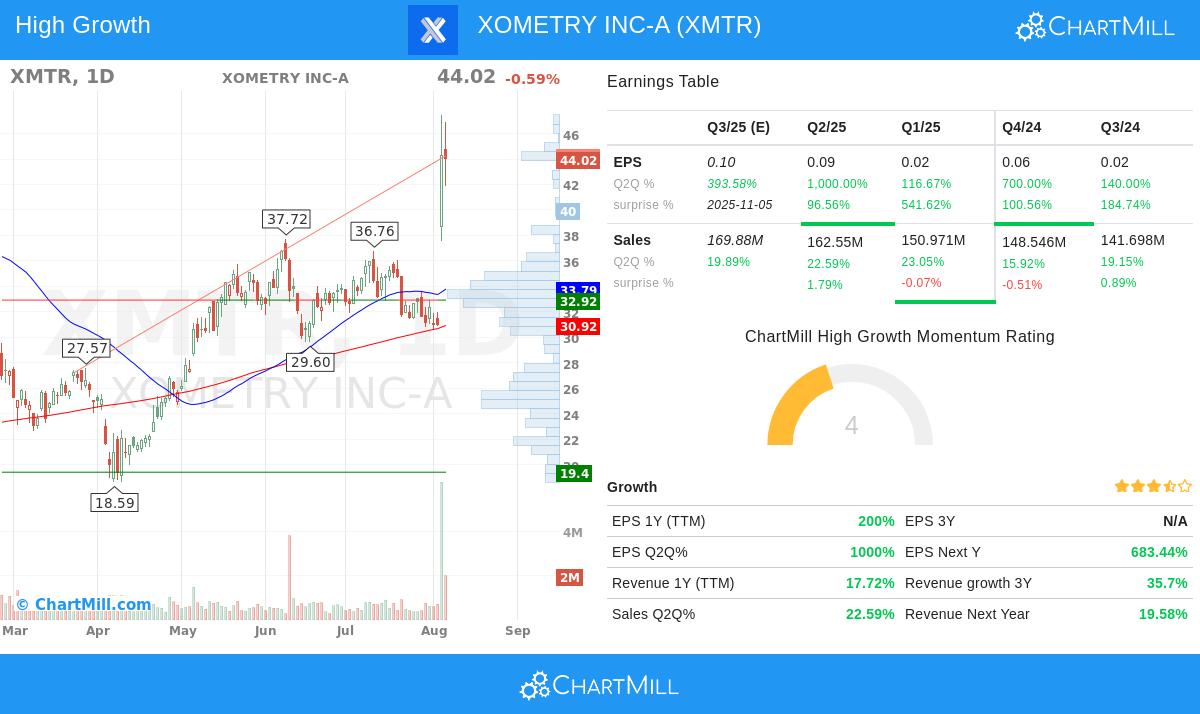
- Price Above Key Moving Averages: The stock is above its 50-day ($33.79), 150-day ($31.18), and 200-day ($30.92) moving averages, confirming a positive long-term trend.
- Rising Moving Averages: Both the 150-day and 200-day moving averages are moving higher, indicating the stock’s strength.
- Relative Strength: With a ChartMill Relative Strength (CRS) score of 97.13, XMTR performs better than 97% of all stocks, a sign of market leadership.
- Price Near 52-Week High: The stock is within 7.2% of its 52-week high ($47.46), reflecting strong momentum.
These factors match Minervini’s focus on stocks already in a Stage 2 uptrend, avoiding uncertain lows and concentrating on confirmed strength.
Strong Growth Momentum Fundamentals
Beyond technicals, XMTR shows solid growth metrics that attract momentum investors:
-
Earnings Growth:
- EPS Growth (TTM): +200% year-over-year.
- Quarterly EPS Acceleration: Recent quarters show significant growth, with Q2Q EPS up +1,000% in the latest quarter, followed by +116.7% and +700% in prior quarters.
- EPS Estimate Beats: The company has exceeded earnings estimates in all of the last four quarters, with an average beat of 229.8%.
-
Revenue Growth:
- Revenue Growth (TTM): +17.7% year-over-year.
- Quarterly Sales Growth: The latest quarter saw +22.6% growth, consistent with prior quarters (+23.1%, +15.9%, +19.2%).
-
Upward Revisions:
- Analysts have increased next-year EPS estimates by 1.3% and revenue estimates by 0.7% over the past three months, showing confidence in continued growth.
These fundamentals align with Minervini’s view that stocks with improving earnings and revenue growth often attract institutional interest, leading to further price gains.
Technical Analysis Summary
ChartMill’s technical report gives XMTR a rating of 9/10, noting its strong performance over the past year (+174.4%). Key points:
- Near 52-Week High: The stock is close to its peak, a positive indicator.
- Volume Increase: Recent trading volume has risen, supporting the upward movement.
- Support Levels: Strong support is found at $33.79-$34.25 (moving averages) and $32.92 (horizontal support).
However, the report suggests that while the stock is technically sound, its recent fast rise may call for waiting for a pullback before entering.
Read the full technical analysis here.
Conclusion
XMTR offers a strong case for investors following Minervini’s strategy, combining a solid technical setup with high-growth fundamentals. Its upward trend, earnings momentum, and institutional interest make it worth further study, though waiting for a better entry point may be wise given its recent advance.
For more stocks that fit this growth momentum and Trend Template criteria, explore the High Growth Momentum + Trend Template screen.
Disclaimer: This analysis is for informational purposes only and does not constitute investment advice. Always conduct your own research and consider risk management strategies before trading.