
W R BERKLEY CORP (NYSE:WRB) has been identified as a standout candidate in our Technical Breakout screen. The stock shows a combination of strong technical health and a high-quality setup pattern, making it an interesting prospect for traders looking for potential breakout opportunities.
Technical Strength
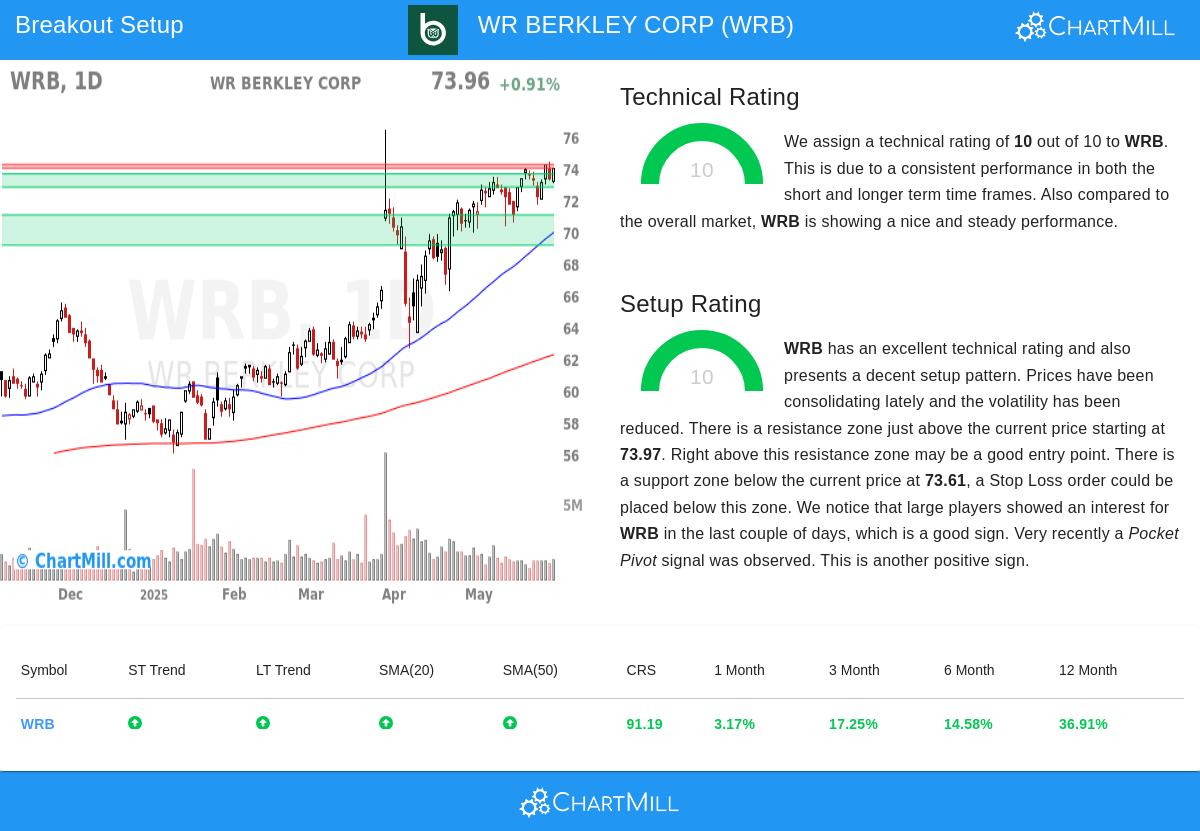
WRB currently holds a perfect Technical Rating of 10, reflecting its strong momentum and trend consistency. Key factors contributing to this score include:
- Positive Trends: Both the short-term and long-term trends are upward, reinforcing the stock’s bullish stance.
- Relative Strength: The stock has outperformed 91% of the market over the past year and ranks in the top tier of its industry (Insurance), beating 89% of peers.
- Moving Averages: The stock is trading above all key moving averages (20-day, 50-day, 100-day, and 200-day), confirming sustained buying interest.
- 52-Week Performance: WRB is trading near the upper end of its 52-week range, aligning with the broader S&P 500’s strength.
Setup Quality
With a Setup Rating of 10, WRB presents a well-defined consolidation pattern, suggesting a potential breakout opportunity:
- Consolidation Zone: The stock has been trading between $70.16 and $74.38 over the past month, with recent price action tightening near the upper boundary.
- Support & Resistance: A clear resistance zone sits just above the current price at $73.97-$74.20, while strong support lies at $72.77-$73.61.
- Volume & Volatility: Trading volume has declined recently, indicating reduced selling pressure, while volatility has contracted—a common precursor to a breakout.
- Institutional Interest: Large players have shown increased buying activity, and a recent Pocket Pivot signal suggests accumulation.
Potential Trade Setup
The technical report suggests a possible entry above $74.21 (just beyond resistance) with a stop-loss below $72.76. This setup limits risk to 1.95%, making it a disciplined approach for traders.
For more details, review the full technical analysis of WRB.
Our Technical Breakout screener provides daily updates on high-quality breakout candidates.
Disclaimer
This is not investment advice. The analysis reflects observations at the time of writing, and market conditions can change rapidly. Always conduct your own research before making trading decisions.