
Western New England Bancorp (NASDAQ:WNEB) has recently appeared on a specific screen built to find stocks that fit Mark Minervini’s momentum-focused growth plan. This method uses strict technical rules from Minervini’s Trend Template along with fundamental growth measures, looking for companies showing solid price movements and quickening business results. The plan focuses on purchasing stocks in established upward trends that have getting-better fundamentals, intending to capture major price gains while controlling risk with strict rules for when to buy and sell.
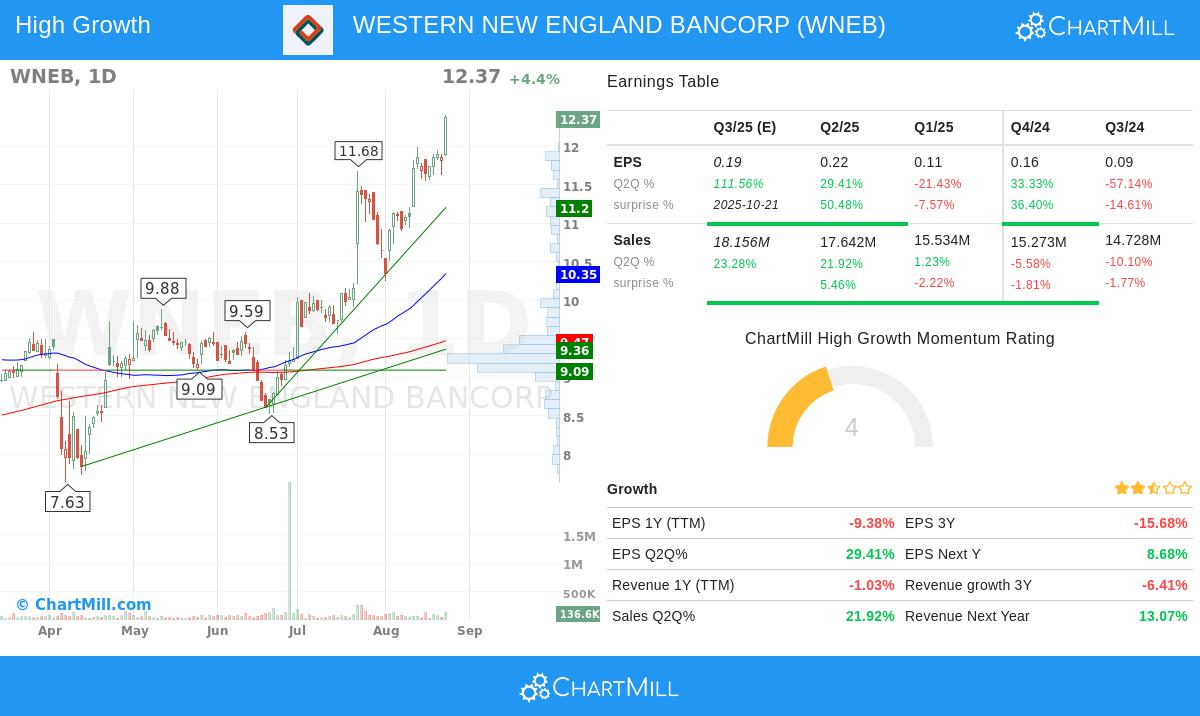
From a technical view, WNEB meets the main needs of Minervini’s Trend Template, which is made to find stocks in solid upward trends. The present price of $12.37 trades much higher than important moving averages, like the 50-day ($10.35), 150-day ($9.58), and 200-day ($9.47) averages, with each of these averages moving up, a signal of continued positive momentum. Also, the stock is trading within 25% of its 52-week high of $12.41 and is over 30% above its 52-week low of $7.63, showing a good recovery and nearness to new highs. Its relative strength ranking of 89.27 further proves it is doing better than most stocks in the market, a main part of Minervini’s focus on market leaders.
On the fundamental side, WNEB shows several traits that interest growth investors. Recent quarterly earnings per share grew 29.41% year-over-year, and sales rose by 21.92%, showing clear quickening in operational results. Even though yearly EPS growth has been uneven, the large gain in the newest quarter points to a possible turning point. The bank also shows strength in analyst forecasts, with next-quarter EPS growth expected at 111.56% and revenue growth predicted at 23.28%. These upward changes frequently draw institutional attention, a driver Minervini notes as important for continued price momentum.
Profitability measures are mixed but indicate space for gains, with the latest quarterly profit margin at 13%. While this is lower than amounts from earlier years, the step-by-step gain from the previous quarter’s 18.33% suggests the company may be handling difficulties well. Free cash flow production, though lower year-over-year, stays positive, backing the company’s capacity to fund operations and possible growth efforts.
The technical analysis report scores WNEB very highly, giving a top score of 10, showing its solid trend agreement, better performance compared to similar companies, and recent move to new 52-week highs. Both short and long-term trends are good, and the stock is trading close to the top of its recent range. However, the report mentions that volume has been lower during the newest rise, which may call for care, and indicates that the stock might gain from a period of stability to provide a more favorable risk-aware entry point.
For a complete technical examination, readers can see the full technical analysis report for WNEB.
Investors curious about finding other high-growth momentum choices that satisfy the Minervini Trend Template requirements can see more screening outcomes through this specialized stock screen.
Disclaimer: This article is for informational and educational purposes only and does not constitute investment advice. Readers should conduct their own research and consult with a qualified financial advisor before making investment decisions.