
Technical breakout setups are a common strategy for traders aiming to profit from stocks showing strong momentum and consolidation patterns. The method uses two main metrics: the ChartMill Technical Rating, which assesses the overall trend health of a stock, and the ChartMill Setup Quality Rating, which spots whether the stock is forming a high-probability breakout pattern. Stocks with high scores in both metrics often offer good trading opportunities, as they indicate both strong underlying performance and a clear entry point.
WILLIAMS COS INC (NYSE:WMB) recently appeared in a breakout screen, with a Technical Rating of 7 and a Setup Rating of 9, suggesting a strong mix of trend stability and consolidation.
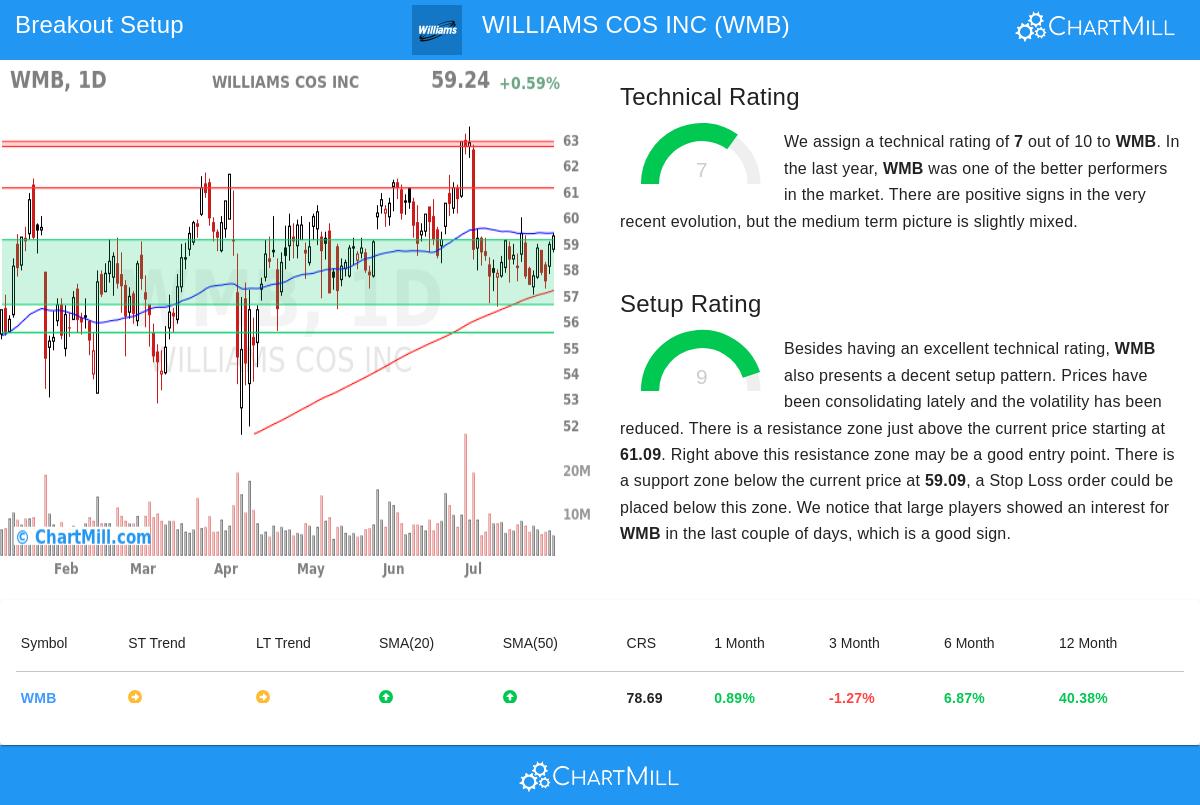
Technical Strength: A Stable Base
The Technical Rating of 7 indicates WMB is in a steady uptrend, backed by several important factors:
- Relative Strength: WMB has performed better than 78% of all stocks over the past year, showing strong market performance. In its industry (Oil, Gas & Consumable Fuels), it ranks in the top 21%, further confirming its strength.
- Price Position: The stock is trading near its 52-week high, though it has not yet reached new highs alongside the broader S&P 500.
- Moving Averages: WMB is above its key moving averages (20-day, 50-day, 100-day, and 200-day), supporting a positive trend.
While short- and long-term trends are currently neutral, the stock’s steady upward movement and resilience in its sector make it a technically solid choice for potential gains.
Setup Quality: A Tight Consolidation with Breakout Possibility
The Setup Rating of 9 points to an ideal consolidation pattern, suggesting a breakout may be forming. Key details include:
- Support and Resistance:
- Support is clear between $56.60 and $59.09, supported by multiple trendlines and moving averages.
- Resistance is at $61.09, with another zone between $62.68 and $62.88. A move above $61.09 could lead to further gains.
- Lower Volatility: Recent price action has narrowed, hinting at a possible buildup before a directional move.
- Institutional Activity: Large investors have increased their involvement in WMB, a positive sign for potential follow-through.
Trade Setup Details
The technical report suggests a potential trade setup with:
- Entry: A buy stop order above resistance at $61.10.
- Stop Loss: Below support at $56.95, representing a 6.8% risk on the trade.
- Risk Management: For a 1% portfolio risk, allocating 14.7% of capital to this trade fits with careful position sizing.
While the setup looks promising, traders should watch broader market conditions and sector trends, especially in energy, which can impact WMB’s performance.
Discovering More Breakout Opportunities
For traders looking for similar high-quality setups, the Technical Breakout Setups Screen offers a selected list of stocks meeting these criteria.
Disclaimer: This analysis is for informational purposes only and should not be seen as investment advice. Always do your own research and consider risk management strategies before trading.