
GeneDx Holdings Corp (NASDAQ:WGS) represents a notable case study for investors using a combined high growth momentum and technical breakout method. This method aims to find companies showing outstanding earnings momentum and quickening business fundamentals while also displaying good technical condition and consolidation patterns that indicate possible breakout chances. By selecting for stocks with high scores across growth momentum, technical condition, and setup quality, investors can find securities where fundamental growth matches positive chart patterns.
High Growth Momentum Fundamentals
GeneDx is distinct with a notable High Growth Momentum Rating of 8, showing outstanding performance across several growth measures that are important for momentum investors looking for companies with quickening business patterns. The company's earnings performance has been especially remarkable, with recent quarterly results displaying large growth that meaningfully adds to its high rating.
Key growth measures include:
- Quarterly EPS growth of 600% measured against the same quarter last year
- Trailing twelve-month EPS growth of 174%
- Revenue growth of 46% in the most recent quarter
- Four straight quarters of positive earnings surprises, averaging 287%
The company's profit margin increase from 5.7% to 10.5% over recent quarters shows better operational efficiency, while analyst opinion has become more positive with next-year EPS estimates adjusted upward by 71% over the past three months. These fundamental traits match well with high growth momentum methods that focus on quickening earnings, growing margins, and positive estimate changes as main causes of stock price increases.
Technical Condition Evaluation
According to the detailed technical analysis, GeneDx displays very good technical condition with a Technical Rating of 9, putting it with the market's best performers from a chart viewpoint. The stock shows better relative strength, performing better than 94% of all stocks in the market over the past year and placed in the top 8% of its healthcare services industry group.
The technical view shows:
- Long-term trend stays positive in spite of recent neutral short-term movement
- Trading in the higher part of its 52-week range between $55.17 and $136.00
- Several moving averages (50-day, 100-day, and 200-day) all moving upward
- Steady performance spread across the year instead of focused gains
This technical condition is especially important given the present market situation where the S&P 500 shows a positive short-term trend but neutral long-term direction, indicating GeneDx is displaying leader traits that could help it perform better in different market situations.
Setup Quality and Trading Points
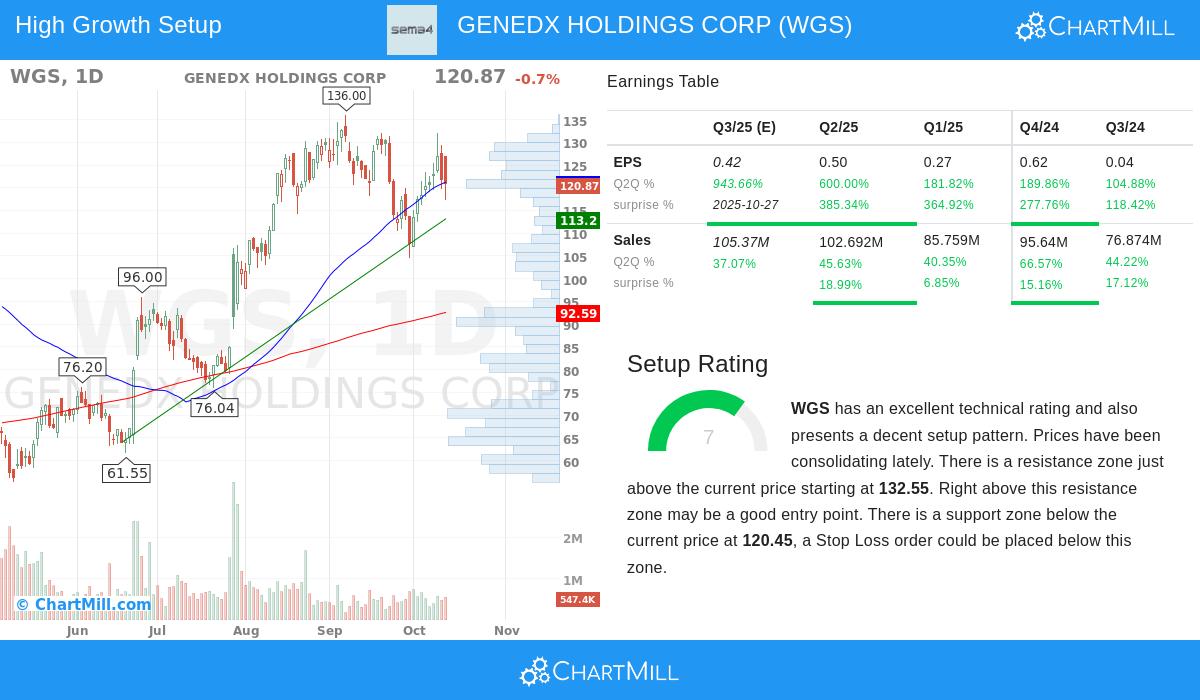
With a Setup Rating of 7, GeneDx presents a possibly positive consolidation pattern for traders expecting a breakout. The stock has been trading in a set range between $104.49 and $132.01 over the past month, with current prices located in the middle of this range. This consolidation period comes after large gains and could represent a healthy stop before the next possible rise.
The technical analysis finds particular price points that traders could watch:
- Resistance area starting at $132.55, which might act as a possible breakout point
- Support area between $115.37 and $120.45, giving a reasonable zone for stop-loss positioning
- Automatic trading setup indicating entry above $132.56 with exit below $115.36
This setup quality is important for momentum investors because it helps find good entry points after consolidation periods, possibly improving risk-reward situations by entering as new momentum starts instead of following extended movements.
Investment Meaning
The mix of solid growth momentum, very good technical condition, and a set consolidation pattern makes GeneDx a noteworthy candidate for investors using growth momentum methods. The company's fundamental quickening in earnings and revenue, together with its technical leadership and clear support/resistance points, creates a situation where both growth and technical factors match positively.
For investors wanting to find similar chances, this screening methodology routinely finds stocks meeting these requirements, mixing high growth momentum with quality technical setups.
Disclaimer: This analysis is for informational purposes only and does not constitute investment advice, recommendation, or endorsement of any security. Investors should conduct their own research and consult with a qualified financial advisor before making investment decisions. Past performance does not guarantee future results, and investing in equities carries inherent risks including potential loss of principal.