
For technical investors, a common method involves finding stocks that are both in a solid uptrend and forming a tight consolidation pattern. This pairing indicates a stock has existing momentum and is pausing before a possible next move up, offering a more distinct entry point with clear risk. One tool that measures this method is ChartMill’s Technical Breakout Setups screen, which filters for stocks with a high Technical Rating, indicating good trend condition, and a high Setup Quality Rating, signaling a positive price consolidation. A recent scan using this system has identified Western Midstream Partners LP (NYSE:WES) as a candidate deserving further examination.
Technical Condition and Trend Examination
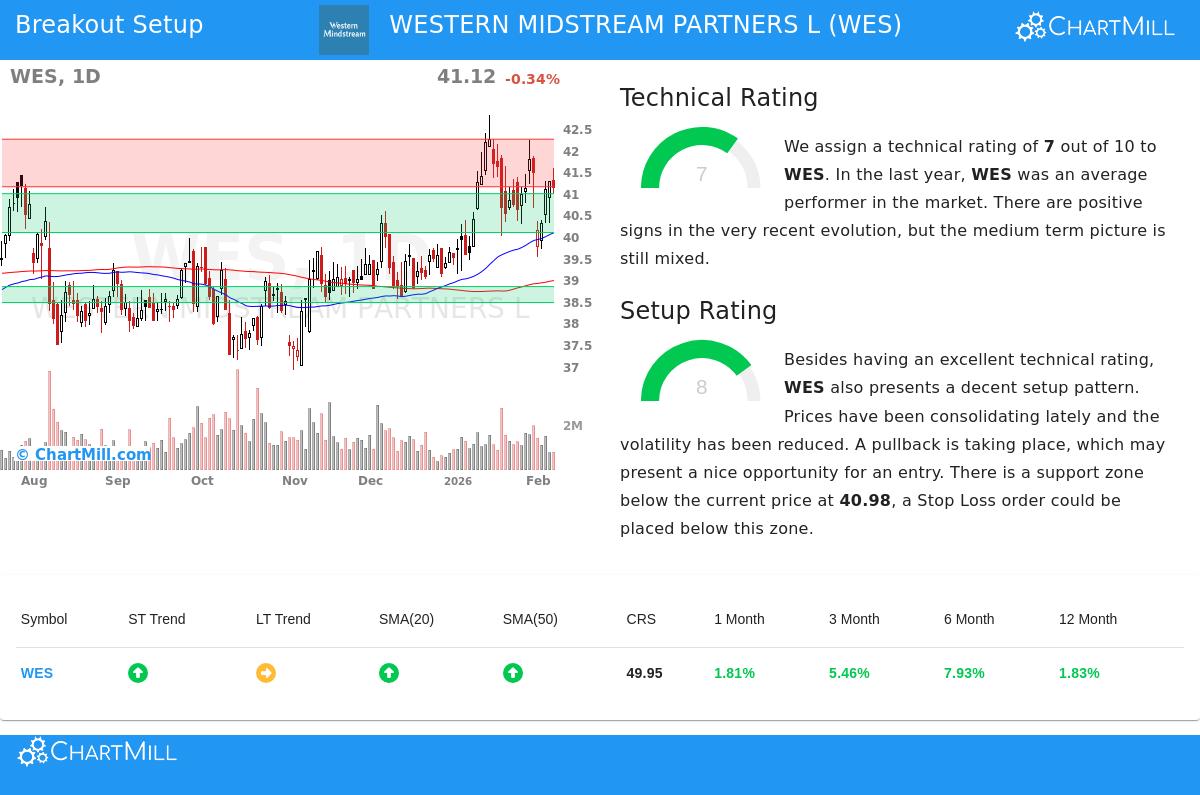
The base of a breakout method is a stock's existing technical condition. WES receives a ChartMill Technical Rating of 7, placing it in the "uptrend" group. This score comes from a multi-factor examination of price action, moving averages, and relative strength. A complete breakdown is available in the full technical report.
Key positive items from the report are:
- Trend Position: The short-term trend is rated as positive, while the long-term trend is neutral. This is seen as a positive development, indicating the stock's momentum is getting better and may be changing into a more lasting uptrend.
- Moving Average Position: The stock is trading above all its major simple moving averages (20, 50, 100, and 200-day), and each of these averages is increasing. This layered position of support levels is a typical sign of positive price structure.
- Market and Industry Position: While WES is trading in the upper part of its own 52-week range, it is noted as performing slightly less than the wider S&P 500, which is near new highs. Its relative strength percentile is near 50, meaning it has performed better than about half of all stocks over the last year. Within its Oil, Gas & Consumable Fuels industry, it performs better than 42% of similar companies. This indicates there is room for improvement if sector sentiment gets better.
Setup Quality and Consolidation Pattern
A solid trend by itself is not sufficient for a good entry; investors need to find a low-risk setup. This is where the Setup Quality Rating becomes important, as it finds periods of lower volatility and price compression. WES scores an 8 on this measure, indicating a good consolidation pattern.
The technical report notes several items adding to this score:
- Specific Trading Range: Over the last month, WES has traded between $39.52 and $42.80. It is currently consolidating in the middle of this range after a recent pullback, which the report indicates may offer a possible entry chance.
- Clear Support and Resistance: The examination identifies a solid support area between $40.08 and $40.98, formed by a combination of trendlines and moving averages. Above current prices, a key resistance area sits between $41.14 and $42.24. This specific definition of price limits allows for exact trade planning.
- Lower Volatility: The report directly states, "We see reduced volatility while prices have been consolidating," which is a characteristic of a high-probability setup. This coiling action frequently comes before a clear price move.
Possible Trade Structure
Based on the technical and setup ratings, ChartMill's examination proposes a specific breakout situation. The logic follows the central method: enter on a confirmed move above resistance, with a stop loss placed below support to control risk.
- Suggested Entry: A buy stop order at $42.25, placed just above the identified resistance area. This would activate only if the stock gains enough momentum to break out.
- Suggested Stop Loss: A stop loss order at $40.07, placed just below the main support area. This defines the maximum risk.
- Risk Measures: This setup implies a risk of about $2.18 per share, or 5.16% of the entry price. Using position sizing, an investor could allocate money so that the total portfolio risk from this trade stays at a controllable level, such as 1%.
It is important to note that this is an example created from the technical pattern. Investors should always perform their own examination, considering items like upcoming earnings, sector news, and overall market conditions, which currently show a positive short-term trend for the S&P 500.
Finding Additional Breakout Chances
WES shows the kind of chance the Technical Breakout Setups screen is made to find. For investors looking for a systematic way to find similar candidates, new possible setups are found daily. You can run the latest scan and see the full examination for other stocks by visiting the Technical Breakout Setups page.
Disclaimer: This article is for informational purposes only and does not constitute investment advice, a recommendation, or an offer or solicitation to buy or sell any securities. The examination and trade ideas presented are based on technical indicators and are created automatically. They do not consider your personal financial situation, investment objectives, or risk tolerance. You should conduct your own research and consult with a qualified financial advisor before making any investment decisions. Past performance is not indicative of future results. Investing involves risk, including the potential loss of principal.