
The method used to find possible investment choices joins a strict technical structure with attention to business momentum. This process is guided by the ideas of trader Mark Minervini, which stress purchasing stocks already in a strong upward trend, backed by solid and quickening fundamental growth. The technical base uses Minervini's Trend Template, a list made to sort for stocks showing clear, continued upward movement across various time periods. This is combined with a filter for high growth momentum (HGM), which looks for firms with better earnings and sales growth, positive estimate changes, and good profit margins. The aim is to locate securities where excellent business results are being acknowledged and valued by the market through continued price gains.
Meeting the Minervini Trend Template Criteria
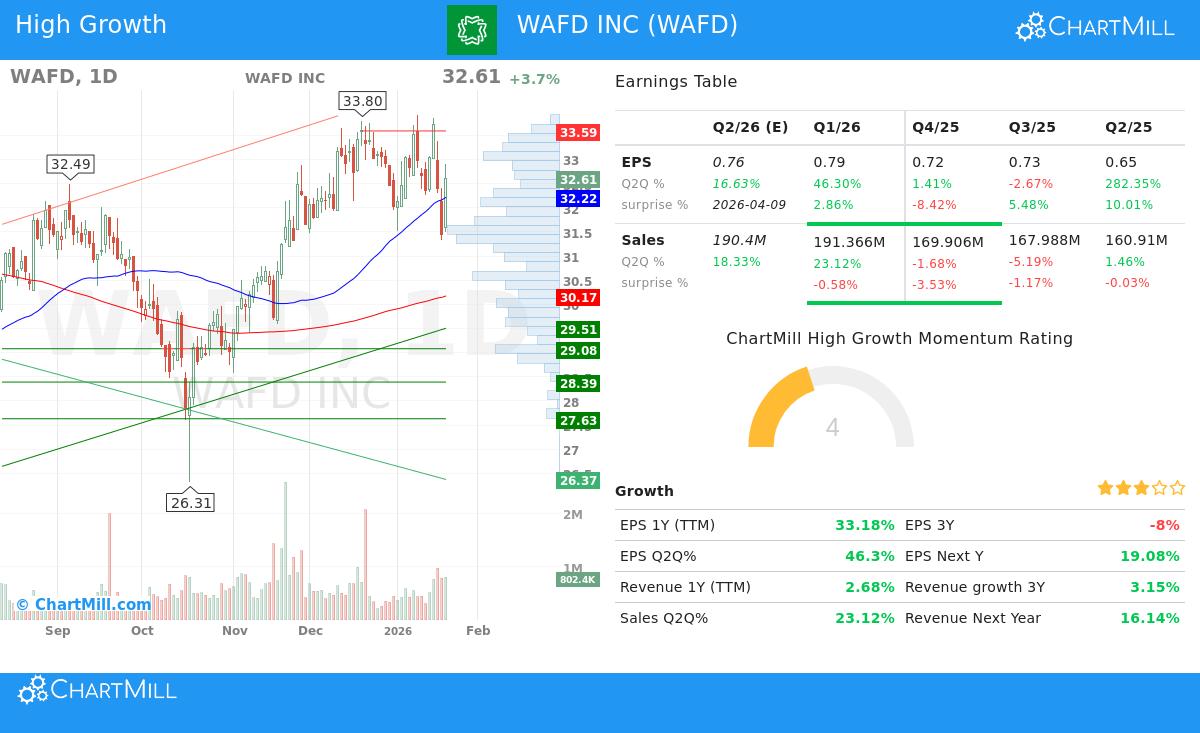
For a stock to be reviewed under this joined strategy, it must first meet the strict technical needs of the Trend Template. WAFD INC (NASDAQ:WAFD) now matches these important momentum filters:
- Price Above Key Moving Averages: The stock's last price of $32.61 trades above its rising 50-day ($32.22), 150-day ($30.81), and 200-day ($30.17) simple moving averages. This arrangement shows continued buying interest across short, intermediate, and long-term periods.
- Positive Moving Average Alignment: The 50-day moving average is above both the 150-day and 200-day averages, and the 150-day is above the 200-day. This ordered positive arrangement, often named a "stacked" setup, confirms a solid and orderly uptrend.
- Proximity to Highs: The current price is within 4% of its 52-week high of $33.92 and is about 37% above its 52-week low of $23.75. This fits the template's need of being within 25% of the high and at least 30% above the low, focusing the search on market leaders, not weaker stocks in recovery.
- Strong Relative Strength: With a ChartMill Relative Strength (CRS) score of 70.82, the stock is doing better than more than 70% of the market. Minervini notes that the largest winners usually have RS scores above 70, ideally in the 80s or 90s, showing they are with the market's best performers.
This technical view indicates WAFD is in a clear Stage 2 advance, the main phase sought by the strategy for its chance to provide large gains.
Qualifying for High Growth Momentum
Beyond the chart, the strategy requires proof of fundamental quickening. The High Growth Momentum rating checks recent and expected business performance. WAFD displays several strong points that add to this review:
- Solid Earnings Growth: The company has reported strong year-over-year earnings per share (EPS) growth. The latest quarter showed a rise of 46.3%, and EPS growth over the trailing twelve months (TTM) is a notable 33.2%. This quickening is an important sign, as "big earnings attract big attention" from institutional investors.
- Positive Estimate Revisions: Analysts have raised their revenue estimates for the next fiscal year by 8.3% over the past three months. Upward changes are a main part of the strategy, showing growing analyst belief in the company's future, which often comes before more price gains.
- Good and Getting Better Profitability: The bank's profit margin in the last reported quarter was a sound 30.2%. More significantly, this shows a sequential gain and a large increase from the 25.5% margin reported three quarters earlier. Improving margins show pricing ability and operational effectiveness, signs of a good growth company.
- Firm Revenue Path: While recent quarterly revenue growth has varied, the latest quarter showed a solid 23.1% year-over-year increase. The forward estimate for next quarter's sales growth is also positive at 18.3%, showing expectations for continued business growth.
Technical Health and Setup Assessment
A look at the given technical analysis report gives a balanced view of WAFD's current chart position. The stock gets a medium technical rating of 6 out of 10. The long-term trend is viewed as positive, supported by its place above key rising moving averages. However, the short-term trend is seen as neutral, with the stock trading in the middle of its recent one-month range between $31.33 and $33.92. This pause follows a time of solid performance.
Importantly, the setup quality rating is now low at 3. The report notes that price movement has been "a little bit too volatile to find a nice entry and exit point" and proposes waiting for a tighter consolidation pattern, like the Volatility Contraction Pattern (VCP) preferred by Minervini, to form. The report finds a clear resistance area between $32.76 and $33.74, which matches the recent 52-week high. A clear move above this zone on high volume could signal the next upward move. Support is viewed near $29.39 and further down at $27.81. You can see the full technical review here.
Conclusion
WAFD INC shows a situation where a solid fundamental growth picture—marked by quickening earnings, positive estimate changes, and margin gain—is paired with a stock chart that fits the standard needs of a set uptrend per the Minervini Trend Template. This match is the center of the joined strategy. However, the present technical analysis suggests the stock is in a near-term pause phase. For investors using this method, WAFD may deserve a spot on a watchlist. The best case would involve the stock forming a tighter, lower-volatility base (bettering the setup quality) before trying a solid move above its recent resistance, which could provide a more clear, lower-risk entry point as described in the Minervini method.
Find Similar Opportunities This review of WAFD was created from a screen made to find stocks fitting both the Minervini Trend Template and High Growth Momentum needs. You can search the current market for similar possible choices by using the High Growth Momentum + Trend Template screen.
Disclaimer: This article is for informational and educational purposes only and is not intended as investment advice. The analysis is based on data provided and specific screening methodologies. It does not constitute a recommendation to buy, sell, or hold any security. Investors should conduct their own research and consider their individual financial circumstances and risk tolerance before making any investment decisions. Past performance is not indicative of future results.