
For investors who use technical analysis to find possible trades, the search often comes to two main questions: which stock is in a good trend, and when is the best time to enter that trend? A structured way to answer these questions involves looking for stocks that show both sound technical condition and a promising price pattern, indicating a possible breakout is near. This process looks at the condition of the trend and the condition of the setup individually, trying to enter solid stocks as they start a new advance from a time of pause.
One stock that recently appeared from such a breakout filter is Ventas Inc (NYSE:VTR), a real estate investment trust focused on senior housing and healthcare properties. The stock's technical condition and present chart formation offer a strong case for technical investors searching for possibilities in the present market, where the wider S&P 500 holds positive long and short-term trends.
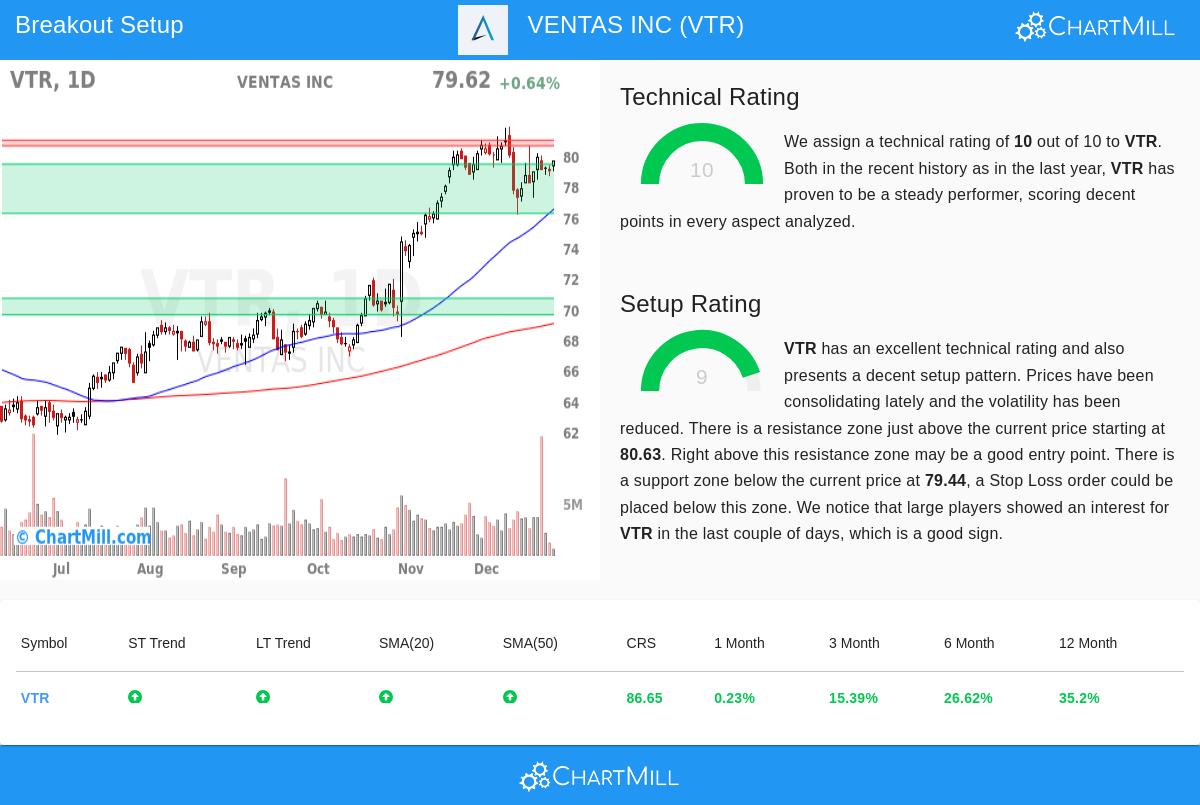
Looking at the Technical Condition
The first part of this plan is finding stocks with better technical condition, as a solid existing trend raises the chance that a breakout will continue. Ventas does very well here, receiving a top ChartMill Technical Rating of 10 out of 10. This leading score is a combined measure checking many elements across different periods, and VTR's report notes several points of notable condition.
- Trend Direction: Both the short-term and long-term trends for VTR are marked as positive. This agreement across periods is a significant bullish sign, showing steady buying interest.
- Relative Performance: The stock is doing better than 86% of all stocks in the market over the last year and beats 93% of its group in the Diversified REITs industry. This shows clear relative condition, a main feature of market leaders.
- Moving Average Condition: The stock price is above all its main moving averages (20, 50, 100, and 200-day), and each of these averages is itself in a rising pattern. This forms a tiered foundation under the price.
- Long-Term Condition: The performance numbers are sound, with the stock up about 35% over the last twelve months and 26% over the last six months.
This top technical rating answers the "which stock" question clearly: VTR is a market leader in its field, backed by solid, multi-period bullish trends. You can see the full technical details in the detailed ChartMill Technical Report for VTR.
Looking at the Setup Condition
A good trend by itself is not a signal to buy; entering a stock that has just jumped can result in quick declines. The second important question—"when to buy"—is answered by the Setup Quality Rating, which finds times of price pause that often come before a new breakout. Ventas gets a 9 out of 10 here, pointing to a high-condition setup.
- Pause Pattern: The stock has been moving in a band between about $76.14 and $81.89 over the last month. It is now placed in the middle of this band, having lowered its movement, which is typical of a pause phase where the stock builds energy for its next action.
- Clear Foundation and Limit: The study finds a set foundation area from $76.22 to $79.44, made by a mix of moving averages and trendlines. Above the present price, a main limit area sits between $80.63 and $81.00. This clear marking of levels gives a plan for possible entry and exit points.
- Large Investor Activity: The report states that big players, as seen by the Effective Volume indicator, have shown activity in VTR in recent days. This can be a supporting sign that informed money is placing itself next to the technical setup.
This high setup score indicates the stock is not stretched but is instead holding inside a band. For a breakout trader, the preferred situation is for the price to move above the noted limit area, showing that the pause has ended and the existing uptrend is starting again.
A Possible Trade Plan
Bringing these two high ratings together forms the ground for a possible breakout trade. The automatic study suggests a specific setup: an entry order could be set just above the limit at $81.01, with a protective stop-loss order set below the foundation area at $76.13. This plan aims to join only if the stock shows condition by breaking out, while firmly capping downside chance by exiting if the breakout does not hold and main foundation is broken. It is a standard example of how the technical and setup ratings are made to work together to find practical possibilities.
Finding More Possibilities Like VTR
Ventas Inc shows the kind of possibility that technical breakout filters are made to find each day. The process that pointed to VTR, filtering for high Technical and Setup Ratings, can be used in a structured way to the whole market.
For investors wanting to see the present list of possible breakout setups, new choices are made daily. You can check the newest results by going to the Technical Breakout Setups screen on ChartMill.
Disclaimer: This article is for information only and is not investment advice, a suggestion, or an offer or request to buy or sell any securities. The trade setup noted is an automatically made example for learning and is not a suggestion. All investing and trading has chance, including the possible loss of capital. Always do your own study, think about your money situation and chance comfort, and talk with a qualified money advisor before making any investment choices. Past results do not show future outcomes.