
Our stock screener has identified VENTAS INC (NYSE:VTR) as a potential breakout candidate. This technical breakout setup pattern occurs when the stock consolidates after a strong uptrend. While the actual breakout is uncertain, it may be worth keeping an eye on NYSE:VTR.
In-Depth Technical Analysis of VTR
ChartMill assigns a Technical Rating to every stock. This score, ranging from 0 to 10, is updated daily and is determined by evaluating multiple technical indicators and properties.
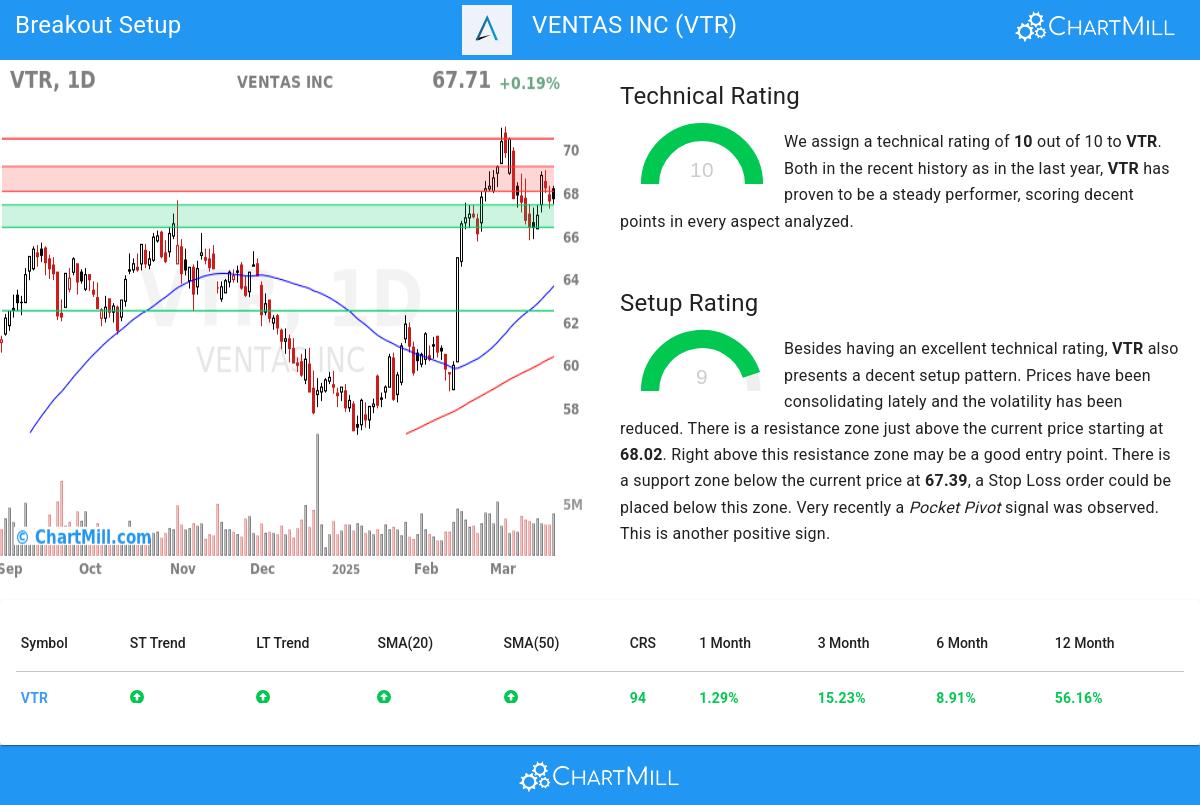
We assign a technical rating of 10 out of 10 to VTR. Both in the recent history as in the last year, VTR has proven to be a steady performer, scoring decent points in every aspect analyzed.
- The long and short term trends are both positive. This is looking good!
- Looking at the yearly performance, VTR did better than 94% of all other stocks. We also observe that the gains produced by VTR over the past year are nicely spread over this period.
- VTR is one of the better performing stocks in the Diversified REITs industry, it outperforms 93% of 129 stocks in the same industry.
- VTR is currently trading in the upper part of its 52 week range. The market is still in the middle of its 52 week range, so VTR slightly outperforms the market at the moment.
- In the last month VTR has a been trading in the 65.70 - 71.04 range, which is quite wide. It is currently trading in the middle of this range where prices have been consolidating recently, this may present a good entry opportunity, but some resistance may be present above.
For an up to date full technical analysis you can check the technical report of VTR
How does the Setup look for VTR
ChartMill incorporates a Setup Rating in its analysis, which measures the extent of consolidation in a stock over recent days and weeks. This rating, ranging from 0 to 10, is updated daily and takes into account multiple short-term technical indicators. The current setup rating for VTR is 9:
Besides having an excellent technical rating, VTR also presents a decent setup pattern. Prices have been consolidating lately and the volatility has been reduced. There is a resistance zone just above the current price starting at 68.02. Right above this resistance zone may be a good entry point. There is a support zone below the current price at 67.39, a Stop Loss order could be placed below this zone. Very recently a Pocket Pivot signal was observed. This is another positive sign.
Trading setups like VTR
To potentially initiate a trade, it is common practice to wait for the stock to break out of the consolidation zone. This breakout signifies a potential upward movement, and traders may enter the stock at that point. Conversely, if the stock falls back below the consolidation zone, it may be sold at a loss.
Important Note: The content of this article is not intended as trading advice. It is essential to perform your own analysis and exercise caution when making trading decisions. The article presents technical observations generated by automated analysis but does not guarantee any trading outcomes. Always trade responsibly and make independent judgments.
More breakout setups can be found in our Breakout screener.
Disclaimer
Important Note: The content of this article is not intended as trading advice. It is essential to perform your own analysis and exercise caution when making trading decisions. The article presents observations created by automated analysis but does not guarantee any trading or investment outcomes. Always trade responsibly and make independent judgments.