
Our stock screener has identified VENTAS INC (NYSE:VTR) as a potential breakout candidate. This technical breakout setup pattern occurs when the stock consolidates after a strong uptrend. While the actual breakout is uncertain, it may be worth keeping an eye on NYSE:VTR.
Analyzing the Technical Aspects
ChartMill assigns a proprietary Technical Rating to each stock. The score is computed daily by evaluating various technical indicators and properties. The score ranges from 0 to 10.
Taking everything into account, VTR scores 10 out of 10 in our technical rating. This is due to a consistent performance in both the short and longer term time frames. Also compared to the overall market, VTR is showing a nice and steady performance.
- The long and short term trends are both positive. This is looking good!
- Looking at the yearly performance, VTR did better than 94% of all other stocks. On top of that, VTR also shows a nice and consistent pattern of rising prices.
- VTR is one of the better performing stocks in the Diversified REITs industry, it outperforms 92% of 129 stocks in the same industry.
- VTR is currently trading in the upper part of its 52 week range. The market is still in the middle of its 52 week range, so VTR slightly outperforms the market at the moment.
- In the last month VTR has a been trading in the 65.70 - 71.04 range, which is quite wide. It is currently trading in the middle of this range where prices have been consolidating recently, this may present a good entry opportunity, but some resistance may be present above.
Check the latest full technical report of VTR for a complete technical analysis.
Why is VTR a setup?
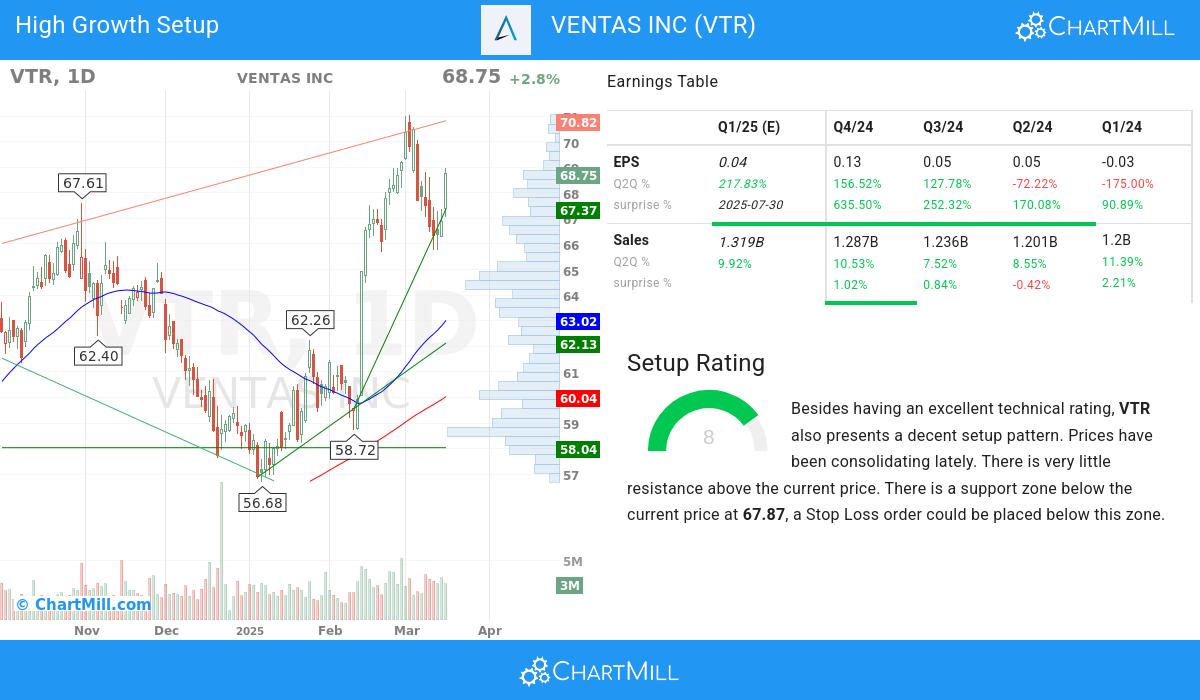
ChartMill also assign a Setup Rating to every stock. With this score it is determined to what extend the stock has been trading in a range in the recent days and weeks. This score also ranges from 0 to 10 and is updated daily. The setup score evaluates various short term technical indicators. VTR scores a 8 out of 10:
Besides having an excellent technical rating, VTR also presents a decent setup pattern. Prices have been consolidating lately. There is very little resistance above the current price. There is a support zone below the current price at 67.87, a Stop Loss order could be placed below this zone.
Assessing Growth for VTR
ChartMill assigns a High Growth Momentum Rating (HGM) to every stock. This score ranges from 0 to 10 and evaluates the different growth and profitability aspects, including accelleration, surprises and revisions. VTR scores a 6 out of 10:
Explosive Earnings Growth
- VTR has shown positive momentum in its earnings per share (EPS) on a quarter-to-quarter (Q2Q) basis, with a 157.0% increase. This reflects the company's successful execution of its business strategies and its commitment to delivering improved financial results.
- The earnings per share (EPS) growth of VTR is accelerating: the current Q2Q growth of 157.0% is above the previous quarter Q2Q growth of 128.0%. Earnings momentum and acceleration are key for high growth systems.
- EPS acceleration happened 3 quarters in a row.
- VTR has achieved 205.0% growth in EPS over the past 12 months, reflecting a sustained improvement in earnings performance.
- VTR shows accelerating Sales growth: when comparing the current Q2Q growth of 10.53% to the previous quarter Q2Q growth of 7.52%, we see the growth rate improving.
- The average next Quarter EPS Estimate for VTR has experienced a 217.0% change in the last 3 months, reflecting evolving expectations by analysts regarding the company's EPS performance.
- With a track record of beating EPS estimates in the last 4 quarters, VTR showcases its consistent ability to deliver earnings surprises. This reflects the company's strong execution and its competitive position in the market.
Financial Strength & Profitability
- VTR has shown positive growth in its operating margin over the past year, indicating improved operational efficiency. This growth highlights the company's ability to effectively manage costs and maximize profitability.
- With a favorable trend in its free cash flow (FCF) over the past year, VTR demonstrates its ability to generate robust cash flows and maintain financial stability. This growth reflects the company's focus on efficient capital allocation and cash management.
- With a Debt/Equity ratio of 1.06, VTR appears to have a manageable debt load relative to its assets.
Strong Market Performance
- VTR has achieved an impressive Relative Strength (RS) rating of 94.29, showcasing its ability to outperform the broader market.
More ideas for high growth momentum breakouts can be found on ChartMill in our High Growth Momentum Breakout screen.
Disclaimer
This article should in no way be interpreted as advice. The article is based on the observed metrics at the time of writing, but you should always make your own analysis and trade or invest at your own responsibility.