
For investors looking for a systematic way to find high-growth market leaders, the CANSLIM method, created by William O'Neil, is a foundational strategy. It joins careful fundamental study with important technical signs to find stocks with good earnings momentum, support from institutions, and better relative price performance, best bought when the general market trend is up. This growth-oriented system searches for companies showing large and frequently speeding quarterly earnings and sales gains, steady yearly growth, and a top position in their sector, all while the overall market direction is favorable.
A recent scan using main CANSLIM filters has identified Vertiv Holdings Co-A (NYSE:VRT) as a possible candidate. The Ohio-based company, which plans and maintains important digital infrastructure for data centers and communication networks, seems to match several of the strategy's key parts.
Reviewing the Fundamental CANSLIM Points
The "C" and "A" in CANSLIM center on current and yearly earnings power, which are basic to seeing a company's growth path. Vertiv's recent results display notable strength in these areas.
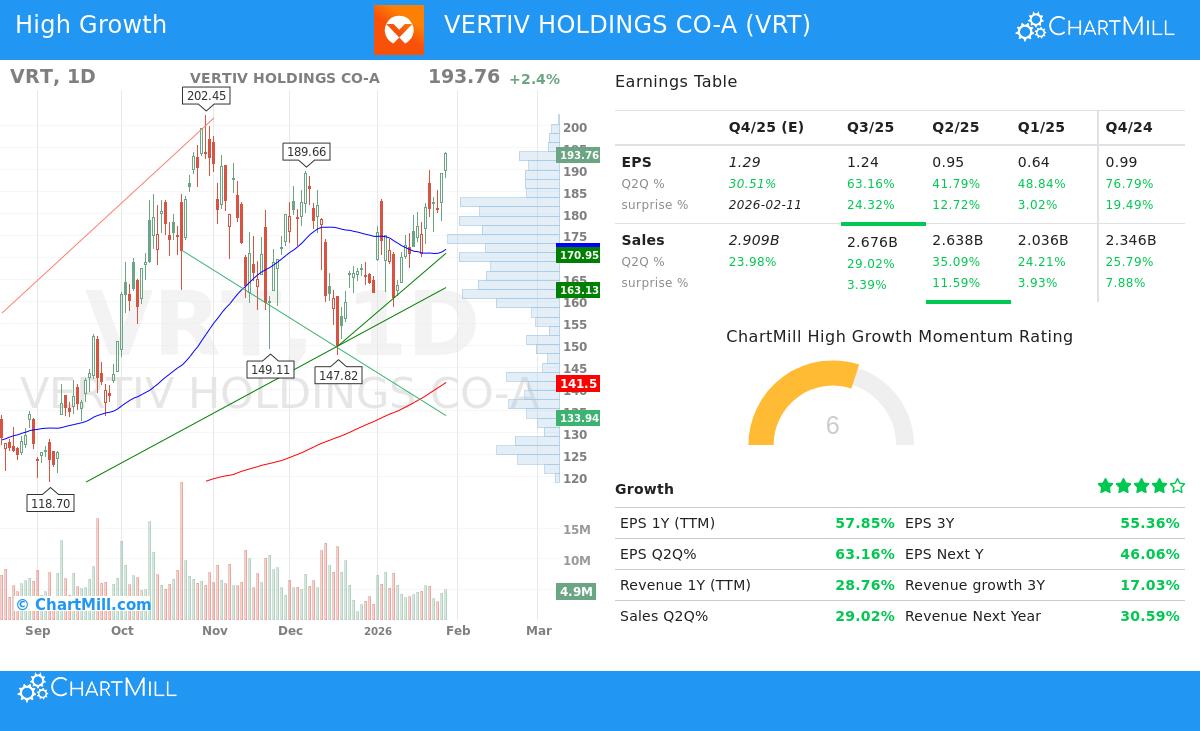
- Current Quarterly Earnings & Sales (C): The system looks for large or speeding growth. Vertiv shows a quarterly earnings-per-share (EPS) growth of 63.2% and sales growth of 29.0% versus the same quarter last year, easily passing the usual minimum levels of 20-25% advised by the method. This points to strong recent operational momentum.
- Annual Earnings Increases (A): To confirm continuity beyond one quarter, CANSLIM requires steady historical growth. Vertiv's three-year EPS compound annual growth rate (CAGR) is a notable 55.4%, well above the common standard of 25%. Also, its Return on Equity (ROE) of 29.5% is higher than the 10% minimum, showing good use of shareholder capital.
The "L" and "I" points assess market view and institutional support. A stock can have very good fundamentals, but a leading position and institutional interest are key for price gains.
- Leader or Laggard (L): This is judged by relative strength (RS), which measures a stock's price action against the wider market. Vertiv has a high RS rating of 88.5, meaning it has done better than almost 89% of all stocks in the last year. This verifies its position as a market leader, a required feature for CANSLIM stocks.
- Institutional Sponsorship (I): The strategy favors stocks with rising institutional ownership, but not so high that all possible buyers are already involved. Vertiv's institutional ownership is about 80.6%, which is under the 85% limit often used in scans, indicating there may still be space for more institutional buying.
Lastly, the "S" point reviews the company's financial setup. Vertiv holds a debt-to-equity ratio of 0.83, which is below the scan's filter of 2, showing a reasonable amount of debt that does not heavily strain the balance sheet.
Technical and Fundamental Condition Summary
Beyond the specific scan filters, a wider view of Vertiv's ratings gives context. The company's total fundamental analysis score is a good 7 out of 10. It gets high scores for profitability and financial condition, with sector-leading margins and returns on capital. Its growth rating is also high (8/10), backed by the very strong past and projected future EPS and revenue growth noted before. The valuation rating is average (5/10), mirroring a premium price-to-earnings ratio that could be acceptable given its exceptional growth and profitability.
From a technical view, Vertiv gets a top rating of 10 out of 10. The technical analysis report states both its long-term and short-term trends are positive, and the stock is trading close to its 52-week high with good trading volume. This fits well with the "M" (Market Direction) and "N" (New Highs) parts of CANSLIM, which stress buying strong stocks in a good market. The present positive trends in the S&P 500 offer a suitable setting as advised by the strategy.
A Candidate for More Study
Based on the used CANSLIM filters, Vertiv Holdings Co displays a notable profile for growth-focused investors. It shows the strong earnings and sales momentum the strategy requires, pairs it with better market-leading relative strength, and indicates acceptable institutional support and finances. The good technical position and favorable market setting further meet key tactical parts of the system.
It is critical to remember that while the stock fits these numerical screening points, the CANSLIM approach also includes qualitative assessment of factors like new products or sector trends, and careful risk control using stop-loss orders. Investors should perform their own complete due diligence on these areas.
For investors wanting to examine other stocks that currently pass similar CANSLIM-based filters, you can view and adjust the scan yourself using this pre-set CANSLIM stock screener.
Disclaimer: This article is for information only and does not form investment advice, a suggestion, or an offer to buy or sell any security. The CANSLIM method involves risk, and past performance does not guarantee future outcomes. Investors should always do their own research and think about their personal financial situation before making any investment decisions.