
Verint Systems Inc (NASDAQ:VRNT) has appeared as a possible choice for investors using value investing strategies. This method, established by Benjamin Graham and later developed by Warren Buffett and Charlie Munger, centers on finding companies trading for less than their intrinsic value. The framework looks for securities where the market price does not completely represent the company's fundamental worth, creating possible chances for investors who can spot these differences. Value investors usually search for stocks with good valuation numbers while also having acceptable financial health, profitability, and growth outlook.
Valuation Metrics
The company's valuation profile presents a strong case for value review. Verint Systems shows very good valuation numbers in several areas:
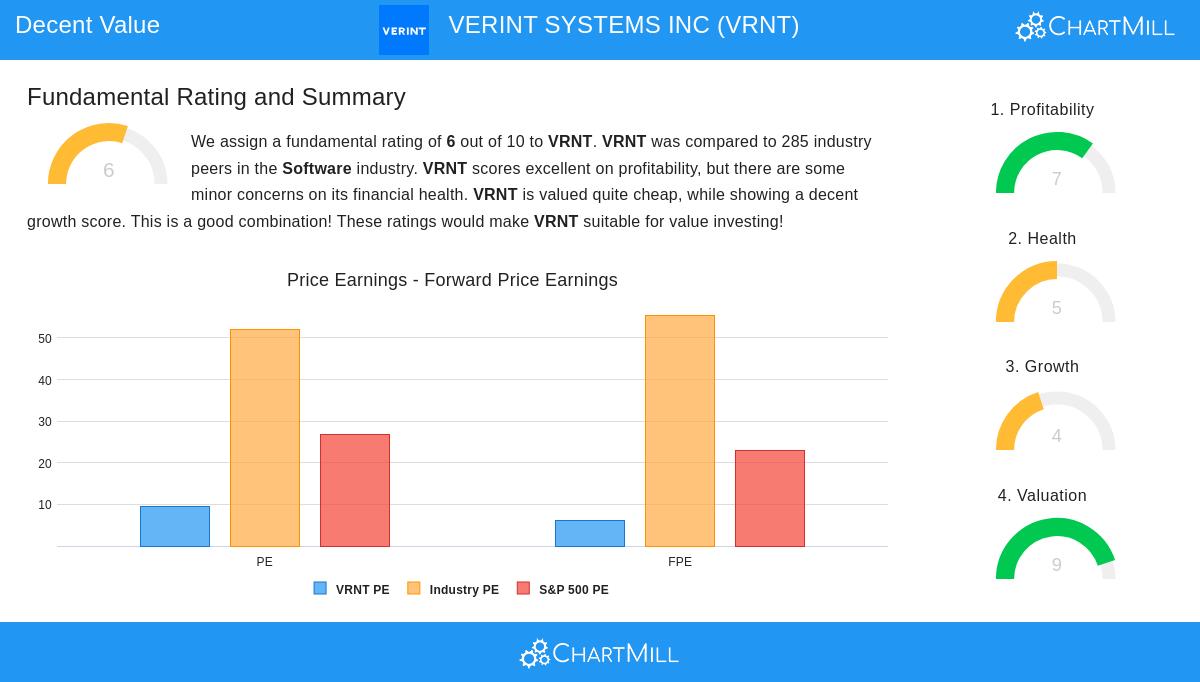
- Price-to-Earnings ratio of 9.43, much lower than the industry average of 52.12 and the S&P 500 average of 26.89
- Forward P/E ratio of 6.18, considerably below the industry average of 55.48 and broader market average of 22.99
- Enterprise Value to EBITDA ratio positioned more favorably than 89% of software industry companies
- Price-to-Free Cash Flow ratio more favorable than 94% of industry rivals
These valuation numbers are especially significant in value investing as they suggest the stock could be trading at a lower price than its intrinsic value. The large discount compared to both industry companies and broader market averages indicates possible undervaluation, a main factor value investors look for when finding investment chances.
Financial Health Assessment
Verint's financial health shows a varied situation that needs thoughtful review. The company has no outstanding debt, placing its Debt-to-Equity and Debt-to-Free Cash Flow ratios in the top tier of the industry. Management has shown shareholder-friendly capital use through steady share buybacks, lowering shares outstanding compared to both one and five years prior. However, questions appear in liquidity measures, with a Current Ratio of 0.65 and Quick Ratio of 0.63 suggesting possible difficulties in meeting near-term responsibilities. The Altman-Z score of 1.22 is below healthy levels, though this number may be less worrying given the company's lack of debt.
For value investors, financial health is a vital part of the margin of safety idea. While the liquidity numbers deserve watching, the lack of debt offers important financial flexibility and lowers bankruptcy risk, creating a cushion against economic declines or operational issues.
Profitability Analysis
Verint shows good profitability basics that back its investment case. The company maintains a Profit Margin of 5.08% and Operating Margin of 8.80%, performing better than 68% and 73% of industry companies respectively. Return numbers show steady performance with Return on Assets at 2.04%, Return on Equity at 3.41%, and Return on Invested Capital at 4.02%, all rated above most software businesses. Margin trends show positive movement, with both Profit Margin and Operating Margin getting better in recent years, while Gross Margin has increased to 69.91%, matching industry norms.
Profitability is a key filter for value investors, as lasting earnings power helps confirm that seeming undervaluation is not just reflecting fundamental business decline. Verint's competitive profitability numbers and improving margin trends indicate the business maintains operational strength in spite of its lower valuation.
Growth Prospects
The growth profile displays changing features with positive forward expectations. Past performance shows difficulties, with Earnings Per Share falling 23.21% in the last year and Revenue going down 2.32%. However, forward estimates point to a major turnaround, with EPS expected to increase 12.05% each year and Revenue forecast to rise 6.30% per year. The quickening growth path represents a good turning point, with both EPS and Revenue growth rates expected to get better compared to past performance.
Value investors understand that growth is a significant part of intrinsic value calculation. The expected quickening in both top-line and bottom-line growth suggests the company could be set to narrow the difference between its current market price and intrinsic value through fundamental business improvement.
Investment Considerations
The detailed fundamental analysis report offers more insights for investors doing complete due diligence. The full assessment scores Verint at 6 out of 10 overall, with especially good results in valuation (9/10) and profitability (7/10), while growth (4/10) and health (5/10) present areas for continued watching.
For investors looking for similar chances, additional value stock options can be found through ChartMill's screening tools. The screening method concentrates on finding companies with good valuation features while maintaining acceptable fundamental strength across other main areas.
Disclaimer: This analysis is for informational purposes only and does not constitute investment advice, recommendation, or endorsement of any security. Investors should conduct their own research and consult with financial advisors before making investment decisions. Past performance does not guarantee future results, and all investments carry risk including potential loss of principal.