
Technical analysis investors often look for stocks displaying both good basic momentum and clear consolidation patterns that indicate possible breakouts. This method uses two specific ChartMill indicators: the Technical Rating, which evaluates a stock's general technical condition and trend force, and the Setup Quality Rating, which finds consolidation phases offering good risk-reward entry points. Stocks with good scores on both measures often present chances where good trends halt briefly before possibly continuing their upward path.
Technical Strength Assessment
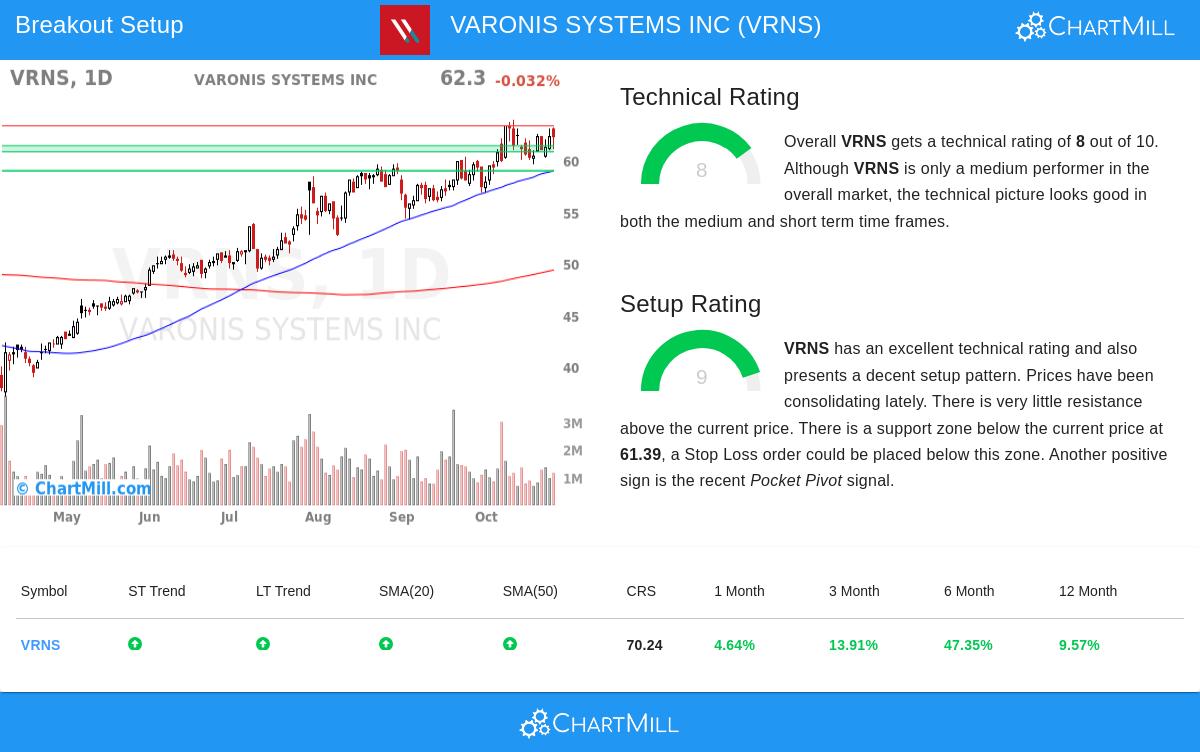
VARONIS SYSTEMS INC (NASDAQ:VRNS) shows good technical features with a Technical Rating of 8 out of 10. This score shows the security's good performance over different timeframes and technical measures. The stock's technical base seems firm based on several main points:
- Both short-term and long-term trends are positive, showing steady upward momentum
- The stock trades close to its 52-week high of $63.90, showing force compared to its past range
- Several moving averages are in a positive alignment, with the 20-day SMA at $60.80, 50-day at $58.96, and 200-day at $49.36 all moving upward
- Relative strength measures show VRNS doing better than 70% of all stocks in the market
According to the detailed technical analysis report, VRNS keeps its technical rating through steady performance across trend, momentum, and moving average parts. This full strength is important for breakout strategies because stocks with higher technical ratings have historically shown a greater chance of continued upward movement after consolidation phases.
Setup Quality Evaluation
The Setup Quality Rating of 9 out of 10 shows VRNS is currently forming a high-grade consolidation pattern. This very good setup score suggests the stock has been trading in a set range, creating a chance for a clear breakout move. Several parts add to this positive setup view:
- Price consolidation inside the $56.82 to $63.90 range over the last month gives a clear trading boundary
- Three separate support zones found at $60.80-$61.39, $58.95-$58.96, and $55.42-$56.02 offer several protection levels
- Little resistance above the current price levels, with only small resistance noted at $63.32
- Recent pocket pivot signal found, showing institutional accumulation
The mix of tight trading ranges, clear support levels, and limited overhead resistance creates situations where breakouts can happen with good risk-reward ratios. For technical traders, high setup quality ratings help find phases when stocks are "coiling" or building energy for their next important move.
Trading Considerations
The technical analysis suggests a possible trading setup with entry at $63.33, placed just above the found resistance level, and a stop loss at $60.79, set below the main support zone. This setup would mean a risk of about 4.01% on the trade. The fairly tight stop loss distance of 1.23 ATR (Average True Range) units shows this is a more forceful method fitting for traders okay with shorter-term positions.
Traders might think about changing position sizing and stop levels based on their personal risk tolerance, especially since the stock's ATR percentage is 3.13%, showing medium daily price movement. The existence of several support levels gives options for traders looking for wider stops for longer-term positions.
Market Context and Industry Positioning
While VRNS shows good absolute performance, its relative strength must be viewed within wider market conditions. The S&P 500 keeps positive trends in both short and long-term timeframes, creating a generally positive setting for breakout strategies. Inside the software industry, VRNS does better than 66% of its 285 peers, placing it as an above-average performer in its sector, not a top leader.
This context is important for breakout traders because stocks breaking out during strong market settings usually have better success rates than those trying to move against wider market trends.
For investors looking for similar technical breakout chances, more screening results can be found using the Technical Breakout Setups screener, which often finds stocks meeting both technical force and setup quality conditions.
Disclaimer: This analysis is based on technical indicators and statistical patterns and should not be taken as investment advice. Always do your own research, think about your risk tolerance, and talk with financial professionals before making investment decisions. Past performance does not promise future results, and all trading involves risk including possible loss of principal.