
In the search for high-potential growth stocks, many investors and traders join detailed technical study with an examination of fundamental momentum. One well-known method that shows this combined view is the system made popular by Mark Minervini. His process, called the Specific Entry Point Analysis (SEPA), joins a strict technical list, the Trend Template, with a study of companies showing strong earnings and sales growth. The aim is to find stocks that are in solid, confirmed uptrends and also supported by fundamental reasons that can push them to become market leaders. This two-step method helps find real candidates instead of temporary moves, directing money toward chances with a greater likelihood of large gains.
Viridian Therapeutics Inc (NASDAQ:VRDN) offers a strong example for this joined method. As a clinical-stage biopharmaceutical company working on treatments for thyroid eye disease (TED), its stock has gained much notice. A recent filter made to find stocks fitting both Minervini's Trend Template and standards for high-growth momentum has found VRDN as a candidate for more study.
Reviewing the Technical Base: The Minervini Trend Template
The Minervini Trend Template is a key part of the SEPA method, giving a fixed group of rules to confirm a stock is in a verified, solid uptrend before review. It works as a quality check, removing weak or corrective shapes. We will look at how VRDN compares against these important technical points:
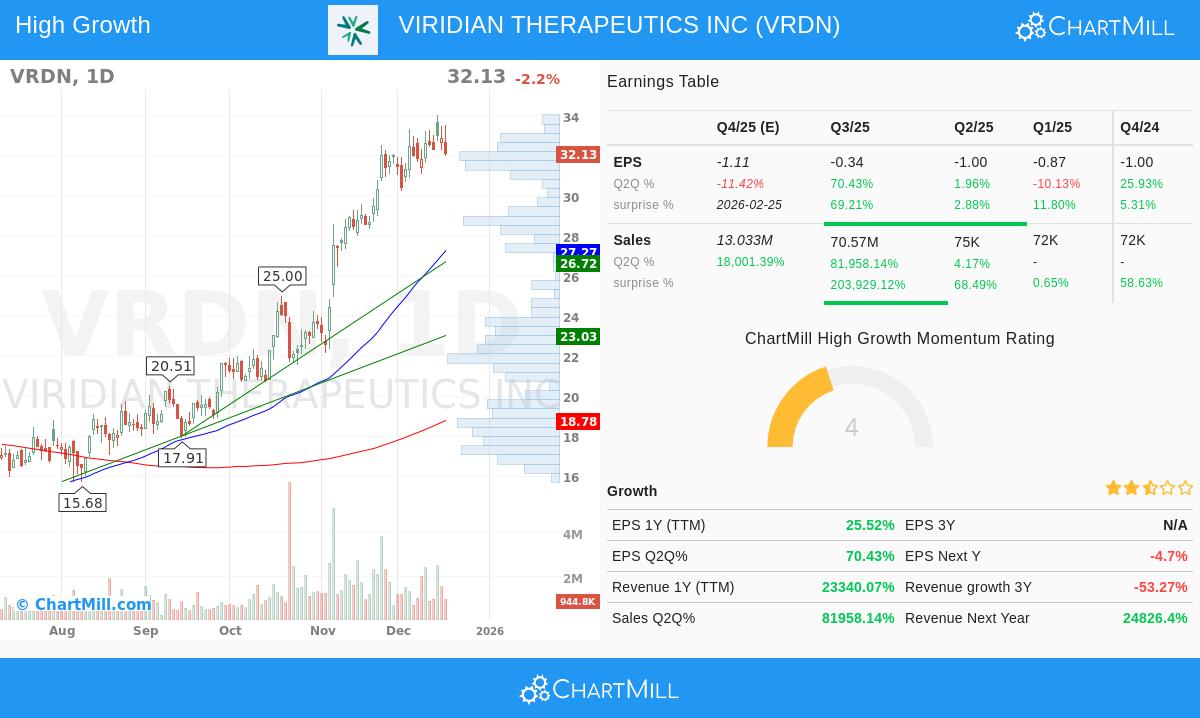
- Price Compared to Key Moving Averages: The stock's present price of $32.13 trades much higher than its rising 50-day ($27.27), 150-day ($20.46), and 200-day ($18.78) simple moving averages (SMAs). This order is a clear sign of continued positive momentum across several time periods.
- Moving Average Order: The order of moving averages, a main Minervini rule, is firmly set. The 50-day SMA is above the 150-day SMA, which is above the 200-day SMA. Also, the 200-day SMA itself has an upward slope, confirming a long-term uptrend is in place.
- Nearness to 52-Week Highs and Lows: VRDN's price is about 225% higher than its 52-week low of $9.90, showing great strength and recovery. At the same time, it trades within 5.6% of its 52-week high of $34.04, showing it is acting like a market leader, not a follower.
- Better Relative Strength: Maybe most notable, VRDN has a ChartMill Relative Strength (CRS) score of 95.29. This means it has done better than 95% of all stocks in the market over the past year, a required feature for Minervini, who focuses on investing in sector and market leaders.
This technical view meets the main needs of the Trend Template, suggesting VRDN is in a solid Stage 2 advance, the exact period where Minervini aims to invest.
Studying the Growth Driver: High Growth Momentum (HGM)
While a strong chart is needed, Minervini's method gives similar importance to fundamental improvement. The "High Growth Momentum" part of the filter looks for companies where business results are turning positive, often working as the reason for the technical move higher. For a biotech company like Viridian, this is judged through clinical progress, financial trends, and analyst views.
- Earnings Trend: Although the company is not yet making money, a normal stage for clinical biotechs, the path of its losses is getting much better. Its Earnings Per Share (EPS) growth on a trailing twelve-month (TTM) basis is over 25%. More importantly, the latest quarter showed a large year-over-year EPS growth of over 70%, pointing to fast operational progress.
- Sales Increase: The sales growth numbers are very high, though from a small start. Quarterly sales growth is more than 81,000% year-over-year, and TTM sales growth is over 23,000%. This shows the first commercialization or licensing steps are having a real financial effect.
- Analyst Belief and Surprises: Viridian has exceeded analyst EPS estimates in each of the last four quarters, with an average beat of over 22%. It has also beaten sales estimates in all four quarters. While analyst changes for next year's EPS have seen some lowering lately, changes for next year's sales estimates have jumped by over 52,000% in three months, showing increasing positive views about its commercial future.
- Sector Position: Inside the competitive Biotechnology field, made of 529 stocks, VRDN does better than 81% of its peers on a price-performance basis. This relative strength inside a strong sector is another sign of a possible leader.
This mix of improving financial measures, steady positive surprises, and strong sector-relative performance gives the fundamental push that can maintain a solid technical trend.
Technical Condition and Setup Summary
A look at the given technical study report gives a combined view of VRDN's chart condition. The report gives the stock a high technical score of 10 out of 10, noting its steady positive trends across both short and long-term periods. The setup quality score is a good 8, showing the stock is moving out of a period of little change inside its larger uptrend, which may offer a possible entry point.
Important technical notes include:
- The stock meets close resistance near the $33.04 level, with a clear move above possibly showing a return of the uptrend.
- Several support areas are noted below, with the closest combined support sitting between $31.62 and $32.12, which could work as a reasonable area for a protective stop-loss.
- The overall summary states that VRDN is trading near its highs with very little resistance above, a good condition for continued upward price action.
For a full look at the support, resistance, and trade setup reasoning, readers can view the complete ChartMill Technical Report for VRDN.
Final Thoughts
Viridian Therapeutics Inc shows the kind of chance aimed for by methods joining Minervini's trend-following rules with growth momentum investing. Its chart shows the clean order of a major uptrend, meeting the strict Trend Template. Fundamentally, it shows the kind of sharp increase in important financial measures, especially sales, that can work as a solid reason, drawing institutional interest and pushing further price gains.
It is important to note that investing in clinical-stage biopharmaceutical companies involves natural risks tied to clinical trial results, regulatory choices, and market competition. The high-growth measures, while notable, are from a new sales base. Any investment should be thought about within a spread portfolio and a clear risk-management plan, using stop-loss orders as guided by the technical setup.
For investors looking for other possible candidates that fit this mix of solid trends and high-growth fundamentals, more study can be done using the set High Growth Momentum + Trend Template screen.
Disclaimer: This article is for informational and educational purposes only. It is not a recommendation to buy or sell any security. The analysis is based on data provided and certain screening methodologies. All investing involves risk, including the potential loss of principal. You should conduct your own research and consult with a qualified financial advisor before making any investment decisions. Please read our full disclaimer here.