
The method used to find possible investment candidates joins a strict technical system with attention to fundamental growth speed. This method is based on the strategies made common by trader Mark Minervini, which stress buying stocks already in solid, confirmed uptrends, what he calls "Stage 2" advances, while also checking the basic company shows speeding business results. The technical base comes from the Minervini Trend Template, a list made to sort for stocks showing better price force and agreement along important moving averages. This is then combined with a review of High Growth Momentum (HGM), which examines recent directions in earnings, sales, and analyst changes to find companies where operational speed is increasing. The aim is to locate securities where strong technical directions are backed by getting better fundamentals, possibly creating the conditions for continued better results.
VIAVI SOLUTIONS INC (NASDAQ:VIAV) appears as a stock that now meets the main conditions of this joined strategy. The company, a supplier of network test, monitoring, and optical security products, is displaying signals of good technical condition and fundamental speed increase.
Technical Force: Matching the Trend Template
A main rule of the Minervini method is to trade in the direction of the current trend, steering clear of the problems of trying to "catch a falling knife." The Trend Template requires discipline by making sure a stock is in a clear, multi-timeframe uptrend before review. VIAV's present chart setup matches these needs closely:
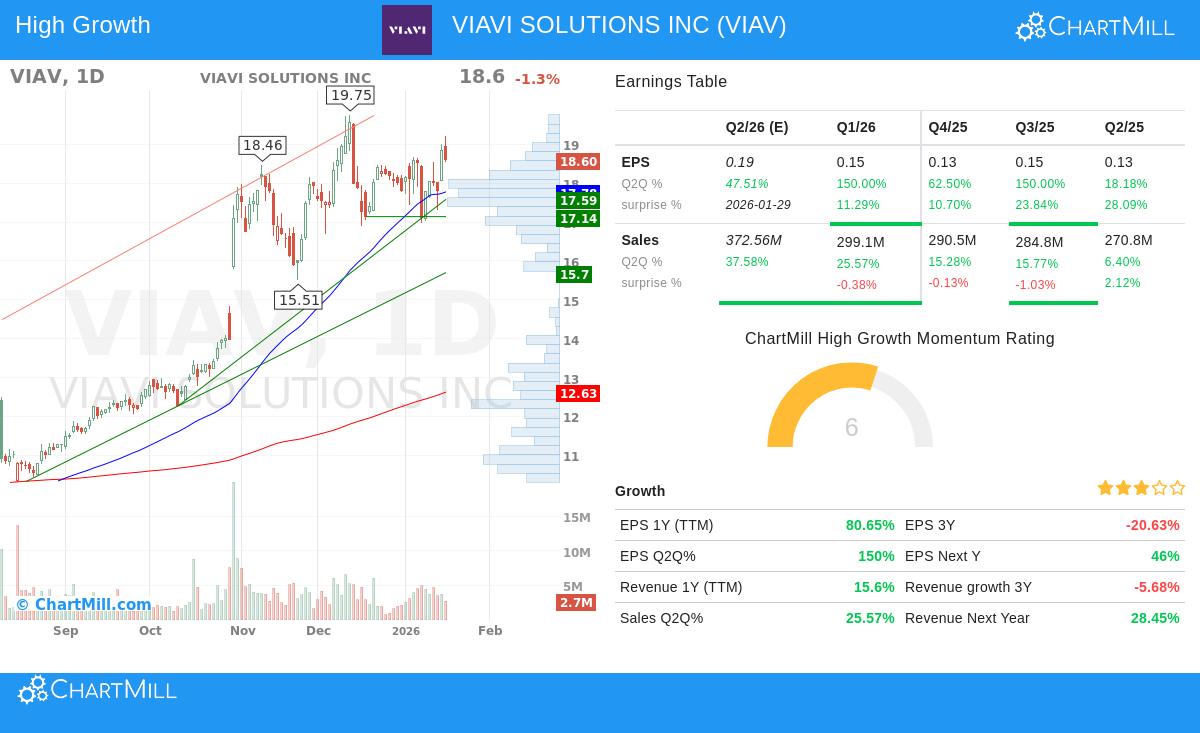
- Price Over Important Averages: The stock's last price of $18.60 trades well over its rising 50-day ($17.78), 150-day ($13.62), and 200-day ($12.63) simple moving averages (SMAs). This order is critical, as it shows the stock is in a positive stage across short, medium, and long-term views.
- Moving Average Order: The 50-day SMA is positioned over both the 150-day and 200-day SMAs, while the 150-day SMA is over the 200-day SMA. This step-by-step order of quicker averages over slower ones is a standard mark of a solid, sound uptrend and points to continued buying pressure.
- Nearness to Highs: At $18.60, VIAV is trading within 6% of its 52-week high of $19.76. The Minervini method prefers stocks close to new highs, as it often shows leadership and an absence of overhead supply from investors waiting to sell at breakeven. Also, the stock is about 130% over its 52-week low of $8.10, showing notable force off its lows.
- Better Relative Strength: With a ChartMill Relative Strength (CRS) score of 94.02, VIAV is doing better than 94% of all stocks in the market over the past year. High relative strength is a key part of the strategy, finding market leaders that often keep leading.
Fundamental Speed: The Argument for High Growth
While a solid chart is necessary, the Minervini strategy tries to know the "why" behind the price action. The High Growth Momentum filter tries to catch companies where recent financial reports are getting much better, possibly working as the reason for the technical breakout.
VIAV's recent fundamental information indicates such a speed increase:
- Earnings Speed Increase: The company has reported a sequence of strong earnings beats. The latest quarter showed year-over-year EPS growth of 150%, coming after growth of 62.5% and 150% in the two earlier quarters. This series of speeding, above-expectation profits is just what growth speed investors look for.
- Solid Sales Growth: Revenue growth has also been good, with the last quarter up 25.6% year-over-year. This shows top-line growth is adding to the bottom-line jump.
- Positive Analyst Changes: Maybe one of the most clear signals of growing speed is when analysts raise their future estimates. Over the past three months, the average analyst estimate for VIAV's next-year earnings has been changed upward by 15.4%, and next-year revenue estimates have been raised by 16.1%. These upward changes often come before more institutional buying.
- Past Growth: On a past twelve-month (TTM) basis, EPS has grown over 80%, much faster than revenue growth of 15.6%, which hints at getting better operational efficiency and margin growth.
This mix of beating estimates, reporting speeding growth, and getting upward changes creates a strong fundamental story that backs the stock's technical rise. It suggests the price force is not only speculative but is supported by real improvements in the company's business path.
Technical Condition Summary
The given technical report gives VIAV a nearly perfect score of 10 out of 10, describing it as a "steady performer." The review states both short-term and long-term trends are positive, and the stock is a leader in its Communications Equipment industry. While the setup score is an acceptable 6, showing the stock is settling after a recent move, the report notes clear support areas under the present price, which can be used to set planned exit points for risk control. For a full list of the support levels, moving average review, and a sample trade setup, readers can see the complete technical analysis report for VIAV.
Locating Comparable Chances
VIAVI Solutions shows the kind of security that gets through a filter looking for both technical soundness and fundamental speed. For investors wanting to use this double-focus screen to find other possible candidates, the preset screen is ready for use. **You can run the "High Growth Momentum + Trend Template" screen yourself to see present results.
Disclaimer: This article is for information and learning only. It is not a suggestion to buy or sell any security. The review is based on given information and a particular investment method. All investing has risk, including the chance of losing the original amount. You should do your own research and think about talking with a qualified financial advisor before making any investment choices.