
For technical investors aiming to find stocks ready for their next rise, a frequent method uses two main parts: a stock's basic technical condition and the nature of its present price formation. The aim is to locate stocks that are already in firm, confirmed upward moves but are now hesitating or moving sideways. These sideways periods, or "bases," frequently come before the earlier trend continues, providing a possible chance to enter with a specific risk level. This method sorts for stocks with both a high "Technical Rating," which measures the trend's force, and a high "Setup Rating," which judges the compactness and condition of the present sideways action.
A recent search for such technical breakout formations has pointed to apparel and footwear company VF CORP (NYSE:VFC) as an example fitting these strict conditions. The company, which owns well-known labels such as The North Face, Vans, and Timberland, is now displaying a price chart that indicates a possible upward move may be developing.
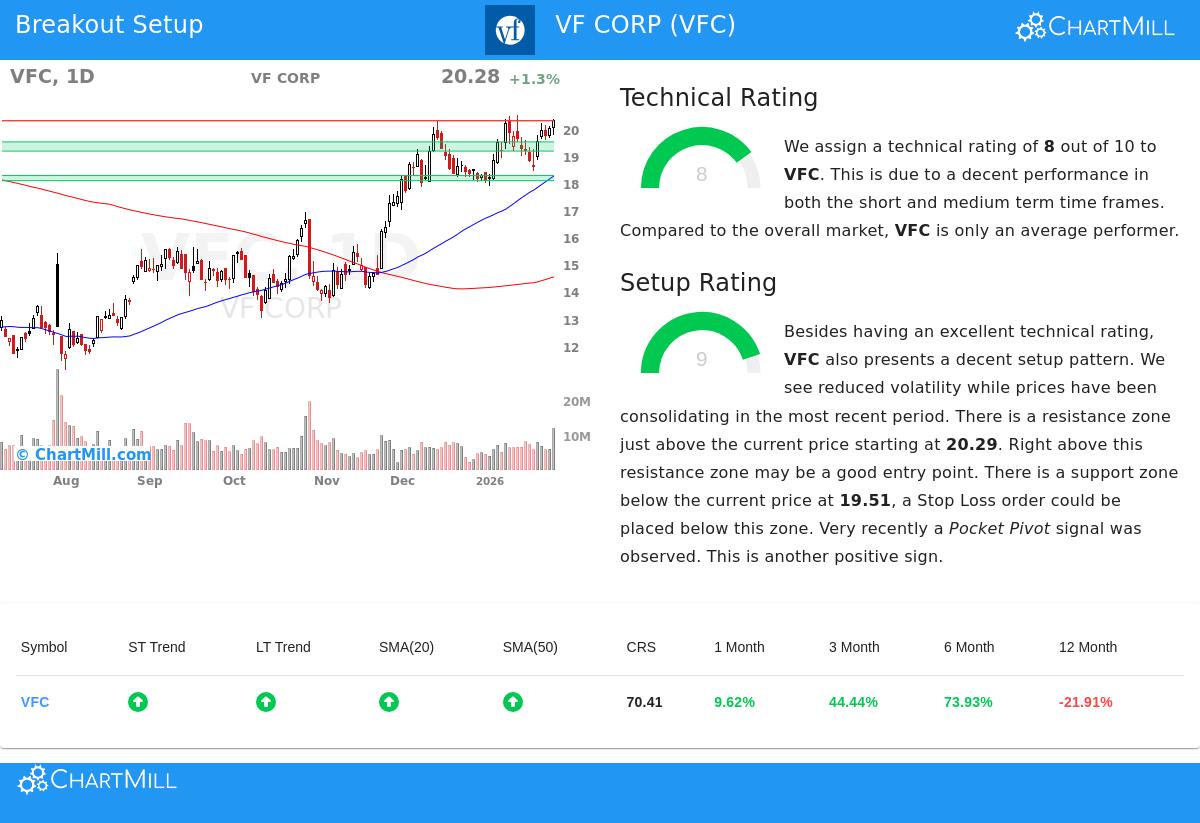
A Technically Sound Base
The first part of this method is finding stocks with good basic technical speed. VF Corp receives a solid ChartMill Technical Rating of 8 out of 10, showing a sound technical position. This number comes from several good points explained in the full technical report.
- Trend Direction: Both the recent and longer-term trends for VFC are marked as good. This agreement across different periods is a strong sign, showing continued buying interest instead of a temporary rise.
- Moving Average Position: The stock's price is above all its important simple moving averages (20, 50, 100, and 200-day), and each of these averages is itself moving upward. This forms a stacked foundation below the present price.
- Relative Performance: In its industry category (Textiles, Apparel & Luxury Goods), VFC is a high performer, doing better than 77% of similar companies. This implies the stock's recent gain is specific to the company and not just a general industry lift.
This good technical rating is key because it addresses the "which stock" question for traders. It sorts for market favorites that have already shown they can draw investment and rise, improving the chance that a move out of a sideways period will work.
A High-Condition Formation Pattern
While a good trend is necessary, buying at the correct moment is also key to avoid entering when a stock is "overstretched" and ready for a decline. This is where the Setup Condition rating is used, dealing with the "when to buy" question. VF Corp gets a very good 9 out of 10 on this measure, pointing to a high-condition sideways pattern.
- Specific Price Channel: For the last month, VFC has been moving in a specific channel between about $17.90 and $20.50. Trading has lately become more compact close to the top of this channel, which often comes before a price move.
- Specific Floor and Ceiling: The study finds a specific floor area between $19.17 and $19.51, made by a mix of trendlines and moving averages. Just above the present price lies a specific ceiling point at $20.29. This creates a specific plan for a possible trade: a move above the ceiling could show the next upward action is starting, while the floor area gives a reasonable place to set a protective stop-loss order.
- Supporting Volume Behavior: A recent "Pocket Pivot" signal was observed, a formation where the stock rises on volume greater than the largest down volume of the previous ten days. This can be an early indicator of large investor buying during a base, adding a positive detail to the formation.
A Possible Trade Plan
From this study, a possible technical trade formation appears. An entry might be thought about on a clear move above the $20.29 ceiling area, possibly using a buy-stop order at $20.30. This would confirm the sideways action has finished and the earlier upward trend is starting again. To control risk, a stop-loss order could be set just below the noted floor area, near $19.16. This plan states the trade's risk from the start, capping the possible loss to about 5.6% on the trade itself.
It is important to state this is an example created from the technical settings. Investors must always do their own study, thinking about points like general market state, the S&P 500's good long and short-term trends now give a supporting environment, and any coming company-specific news or earnings reports.
Locating Additional Chances
The process that found VF Corp can be used in a regular way to discover new possible breakout formations each day. For investors wanting to search the market for similar chances, the Technical Breakout Setups screen is refreshed often with new results. You can see the present list of stocks that qualify by going to the Technical Breakout Setups page.
Disclaimer: This article is for information only and is not investment guidance, a suggestion, or an offer to buy or sell any security. The study shown uses technical measures and past information, which are not promises of future results. All trading and investment choices include risk, including the possible loss of the original investment. Readers should do their own research and talk with a registered financial advisor before making any investment choices.