
Discover VEEVA SYSTEMS INC-CLASS A (NYSE:VEEV), an undervalued growth gem identified by our stock screener. VEEV is shining in terms of growth metrics, and it's also displaying strong financial health and profitability. What's more, it retains an appealing valuation. We'll break it down further.
A Closer Look at Growth for VEEV
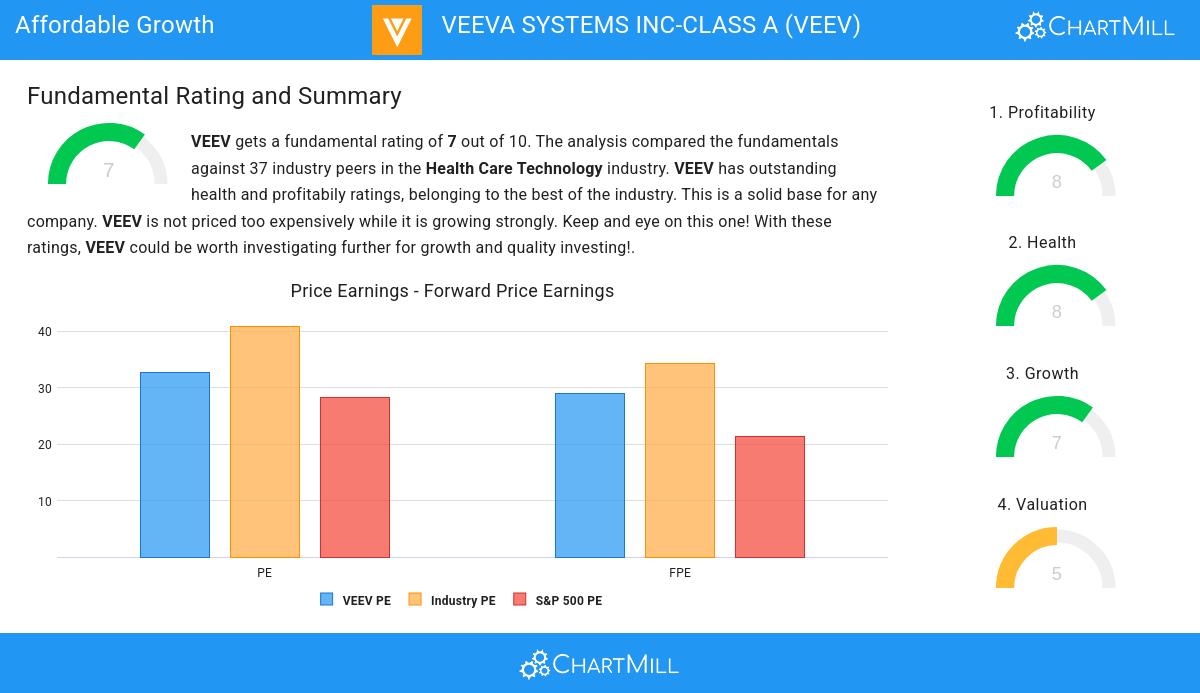
ChartMill assigns a proprietary Growth Rating to each stock. The score is computed by evaluating various growth aspects, like EPS and revenue growth. We take into account the history as well as the estimated future numbers. VEEV was assigned a score of 7 for growth:
- The Earnings Per Share has grown by an impressive 36.57% over the past year.
- The Earnings Per Share has been growing by 24.72% on average over the past years. This is a very strong growth
- The Revenue has grown by 16.20% in the past year. This is quite good.
- Measured over the past years, VEEV shows a quite strong growth in Revenue. The Revenue has been growing by 19.99% on average per year.
- VEEV is expected to show quite a strong growth in Earnings Per Share. In the coming years, the EPS will grow by 14.05% yearly.
- VEEV is expected to show quite a strong growth in Revenue. In the coming years, the Revenue will grow by 13.21% yearly.
Exploring VEEV's Valuation
An integral part of ChartMill's stock analysis is the Valuation Rating, which spans from 0 to 10. This rating evaluates diverse valuation factors, including price to earnings and cash flows, while considering the stock's profitability and growth. VEEV has received a 5 out of 10:
- 83.78% of the companies in the same industry are more expensive than VEEV, based on the Price/Earnings ratio.
- 78.38% of the companies in the same industry are more expensive than VEEV, based on the Price/Forward Earnings ratio.
- Based on the Enterprise Value to EBITDA ratio, VEEV is valued a bit cheaper than 72.97% of the companies in the same industry.
- 81.08% of the companies in the same industry are more expensive than VEEV, based on the Price/Free Cash Flow ratio.
- VEEV has an outstanding profitability rating, which may justify a higher PE ratio.
What does the Health looks like for VEEV
Every stock is evaluated by ChartMill, receiving a Health Rating on a scale of 0 to 10. This assessment considers different health aspects, including liquidity and solvency, both in absolute terms and relative to industry peers. VEEV has achieved a 8 out of 10:
- VEEV has an Altman-Z score of 16.13. This indicates that VEEV is financially healthy and has little risk of bankruptcy at the moment.
- With an excellent Altman-Z score value of 16.13, VEEV belongs to the best of the industry, outperforming 89.19% of the companies in the same industry.
- There is no outstanding debt for VEEV. This means it has a Debt/Equity and Debt/FCF ratio of 0 and it is amongst the best of the sector and industry.
- A Current Ratio of 4.51 indicates that VEEV has no problem at all paying its short term obligations.
- VEEV has a Current ratio of 4.51. This is amongst the best in the industry. VEEV outperforms 91.89% of its industry peers.
- VEEV has a Quick Ratio of 4.51. This indicates that VEEV is financially healthy and has no problem in meeting its short term obligations.
- VEEV has a Quick ratio of 4.51. This is amongst the best in the industry. VEEV outperforms 91.89% of its industry peers.
Assessing Profitability for VEEV
ChartMill's Profitability Rating offers a unique perspective on stock analysis, providing scores from 0 to 10. These ratings consider a wide range of profitability metrics and margins, both in comparison to industry peers and on their own merits. For VEEV, the assigned 8 is a significant indicator of profitability:
- VEEV's Return On Assets of 9.73% is amongst the best of the industry. VEEV outperforms 94.59% of its industry peers.
- With an excellent Return On Equity value of 12.24%, VEEV belongs to the best of the industry, outperforming 94.59% of the companies in the same industry.
- VEEV has a better Return On Invested Capital (9.79%) than 91.89% of its industry peers.
- The last Return On Invested Capital (9.79%) for VEEV is above the 3 year average (9.16%), which is a sign of increasing profitability.
- VEEV has a better Profit Margin (26.00%) than 94.59% of its industry peers.
- Looking at the Operating Margin, with a value of 25.36%, VEEV belongs to the top of the industry, outperforming 97.30% of the companies in the same industry.
- With an excellent Gross Margin value of 74.53%, VEEV belongs to the best of the industry, outperforming 83.78% of the companies in the same industry.
More Affordable Growth stocks can be found in our Affordable Growth screener.
Our latest full fundamental report of VEEV contains the most current fundamental analsysis.
Disclaimer
This article should in no way be interpreted as advice. The article is based on the observed metrics at the time of writing, but you should always make your own analysis and trade or invest at your own responsibility.