
Combining technical and fundamental analysis offers investors a strong framework for identifying stocks with both good underlying business performance and positive price momentum. This dual approach helps filter for companies displaying accelerating growth metrics while also breaking out of consolidation patterns or showing positive technical setups. By focusing on stocks with solid profitability, healthy financials, and impressive growth trajectories, coupled with constructive chart patterns, investors aim to capture opportunities where fundamental strength aligns with positive market sentiment.
Universal Technical Institute (NYSE:UTI) recently appeared in a screen designed to find strong growth stocks with positive technical setups. The screening method highlights companies showing good fundamental growth, sound profitability, and financial health, while also displaying technical patterns indicating potential breakout momentum. This strategy works to identify equities where business performance and market timing may come together positively.
Fundamental Strength and Growth Metrics
Universal Technical Institute operates as a provider of transportation and skilled trades technical training programs, serving a niche but essential segment of the education and workforce development sector. The company’s fundamental profile reveals several strengths that match growth investing criteria:
- Impressive Historical Growth: Over the past year, UTI reported a 128% growth in earnings per share and a 14.56% increase in revenue. The average annual EPS growth rate is 28.35%, while revenue has grown at an average of 17.19% in recent years.
- Profitability and Efficiency: The company has a return on equity of 20.57% and a profit margin of 7.79%, performing better than a significant portion of its peers in the diversified consumer services industry. Its return on invested capital (10.86%) also ranks well, indicating effective use of capital.
- Future Growth Expectations: Analysts project continued growth, with EPS expected to increase by 11.29% annually and revenue by 10.53% over the coming years.
These metrics show why growth investors might find UTI appealing—the company not only has a history of expansion but is also expected to maintain above-average growth, a key factor in targeting stocks that can perform better than broader market indices.
Technical Setup and Price Action
From a technical perspective, UTI presents a mixed but cautiously optimistic picture. The stock has shown resilience over the past year, gaining more than 65%, though it has experienced some recent consolidation. Key technical observations include:
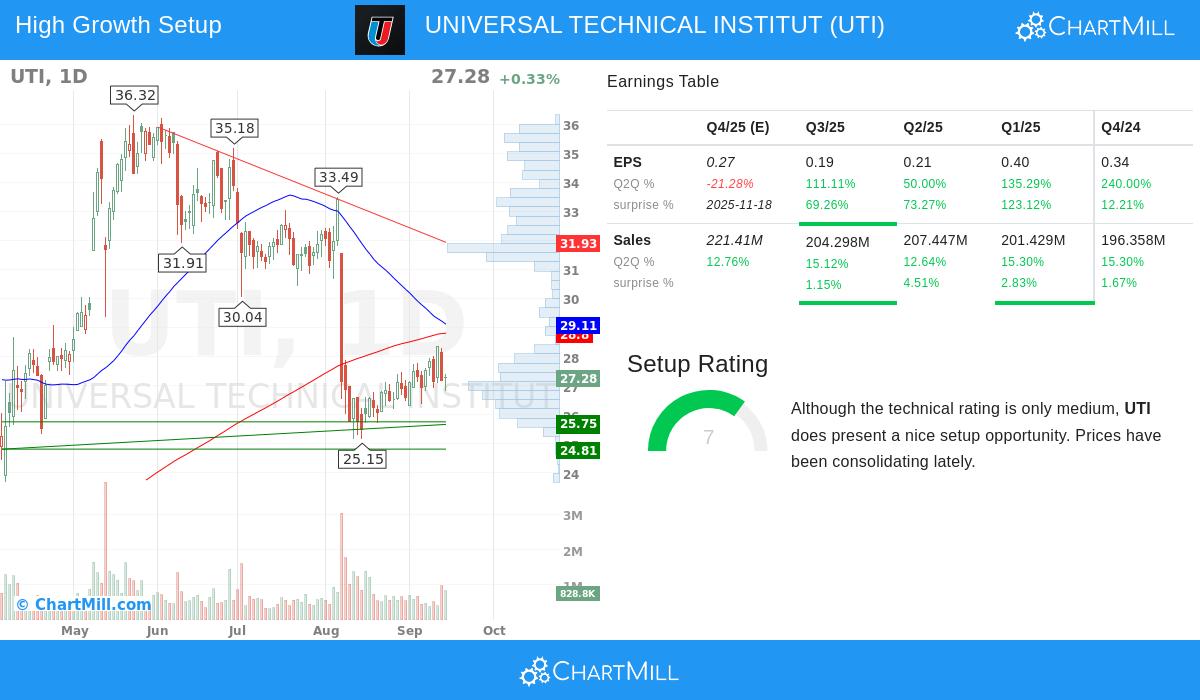
- Consolidation Pattern: The stock has been trading within a defined range between approximately $25.71 and $28.36 over the past month, showing signs of accumulation near support levels.
- Support and Resistance Levels: Important support zones exist around $27.01–$27.21 and $25.50–$26.21, which could provide a foundation for upward movement. Resistance is noted near $27.29–$27.41 and $28.35–$29.11.
- Setup Rating: Despite a moderate overall technical rating, UTI earns a setup rating of 7/10, indicating that recent price action has formed a base that could precede a breakout if positive momentum resumes.
This technical profile suggests that while the stock is not in a strong trend at the moment, it is positioned in a way that could attract buyers if it breaks above key resistance levels, particularly if broader market conditions remain supportive.
Alignment with Screening Criteria
The combination of UTI’s fundamental and technical characteristics makes it an interesting candidate for the growth-and-breakout strategy. Its strong growth metrics, profitability, and financial health (evidenced by a good Altman-Z score and manageable debt levels) fulfill the fundamental filters aimed at identifying companies with sustainable expansion potential. Meanwhile, the technical setup—marked by consolidation near support and a decent setup rating—suggests that the stock may be preparing for its next move higher, offering a favorable risk-reward entry point for momentum-oriented investors.
For a more detailed look into UTI’s technical indicators, readers can review the full technical analysis report, and for a detailed look at its financial health and growth metrics, the fundamental analysis report provides specific insights.
Exploring Similar Opportunities
Investors interested in finding more stocks that fit this profile of strong growth coupled with positive technical patterns can explore additional results through the Strong Growth Stocks with Good Technical Setup Ratings screen. This screen dynamically identifies companies that meet these criteria, offering a practical tool for further research and portfolio diversification.
Universal Technical Institute represents an interesting case where fundamental growth and technical positioning appear to align. However, investors should conduct their own due diligence and consider market conditions, industry trends, and company-specific risks before making any investment decisions.
Disclaimer: This article is for informational purposes only and does not constitute investment advice. The author holds no position in UTI. Investors should perform their own research and consult with a qualified financial advisor before making investment decisions.