
For investors using a technical breakout strategy, the goal is to find stocks that are fundamentally sound in their price trends and ready for a near-term move. This method frequently uses a screen for two key proprietary measures: a high Technical Rating, which shows a stock is in a good, established uptrend, and a high Setup Quality Rating, which shows the stock is moving in a tight range, giving a clear entry point with specific risk. This technique aims to catch the next phase of a current uptrend, steering clear of stocks that are either trending poorly or are already stretched and likely to fall back.
Unum Group (NYSE:UNM), a company offering disability, life, and supplemental insurance, now shows a profile that fits this breakout strategy. Based on a recent ChartMill technical analysis report, the stock gets good scores on both important points, indicating it could be preparing for a possible extension of its upward movement.
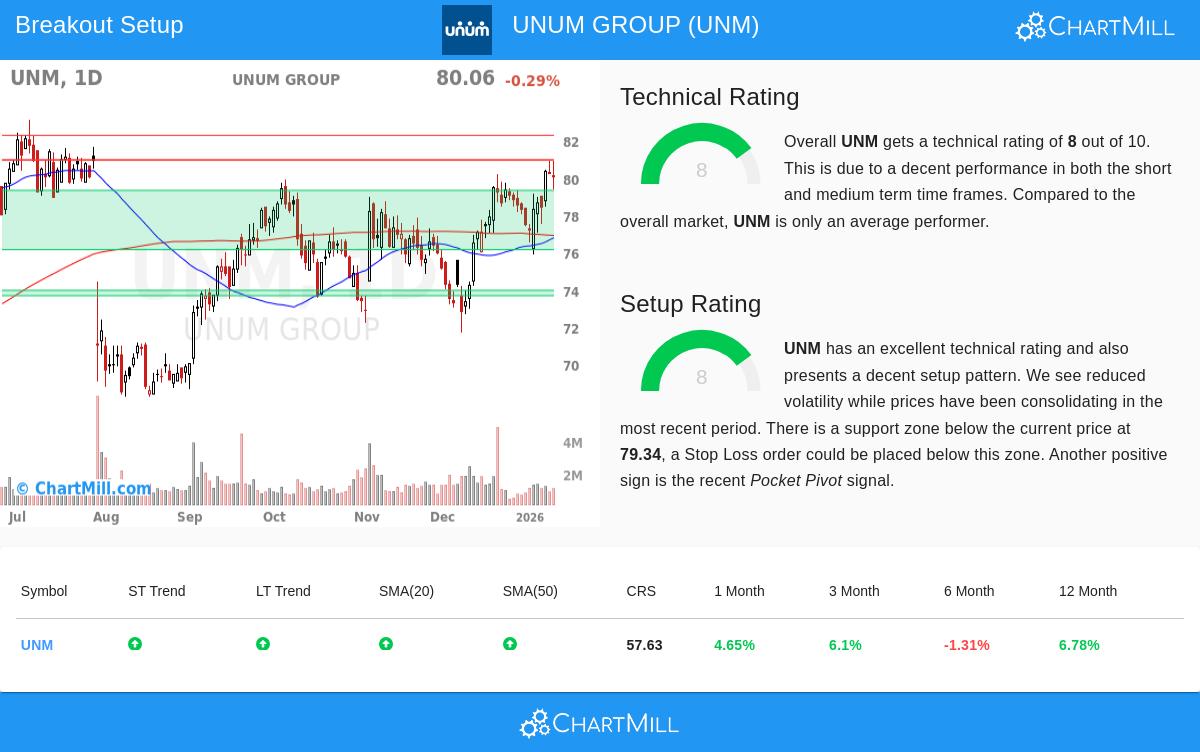
A Base of Technical Health
The foundation of a workable breakout candidate is a sound basic trend. Unum Group’s Technical Rating of 8 out of 10 indicates a technically sound stock. This score comes from combining several elements that verify the stock’s momentum is heading the correct way.
- Positive Trend Agreement: Both the long-term and short-term trends for UNM are seen as positive. This agreement across different periods is a main sign of continued buying interest and lowers the chance that a move is only a brief recovery.
- Sound Moving Average Backing: The stock’s price is above its important short- and medium-term moving averages (20-day, 50-day, and 100-day SMAs), which are all rising. This arrangement often works as a moving support level, a standard trait of stocks in a consistent uptrend.
- Stable Results: While UNM is seen as a medium performer compared to the whole market during the last year, it has shown firm recent momentum, with increases of about 4.7% in the last month and 6.1% in the last quarter.
For the breakout method, this high Technical Rating addresses the "which stock" question. It sorts for equities that are already market leaders or displaying firm relative strength, making sure an investor is not trying to push a breakout in a stock that is fundamentally poor or in a decline.
A Favorable Setup for Entry
A firm trend by itself is not a signal to buy; entering at a bad moment can cause quick losses if the stock is overbought. This is where the Setup Quality Rating is essential. UNM’s score of 8 points to a good consolidation pattern, dealing with the "when to buy" part of the strategy.
- Tight Consolidation: The analysis states that over the last month, UNM has been moving in a set range between about $75.90 and $80.89. It is now trading near the top of this range, showing it is testing a resistance level after a time of coiling price movement.
- Lower Volatility & Clear Support: A favorable setup has lower volatility and a specific support area below the current price. The report finds a main support zone between $76.16 and $79.34, made by a combination of trendlines and moving averages. This gives a sensible level for setting a protective stop-loss order.
- Positive Accumulation Sign: Another bullish sign mentioned in the report is a recent "Pocket Pivot," a pattern that implies accumulation by larger participants as the price rises on higher-than-normal volume. This can be a forerunner to a maintained breakout.
The high Setup Rating verifies that UNM is not stretched; rather, it has formed a base. This consolidation lets earlier buyers secure profits and new buyers to take positions, forming a launch point for the next possible rise. The automated analysis proposes a specific breakout level at $80.98, just above the nearby resistance, with a stop-loss order set below the recent range at $75.89.
Important Levels to Monitor
The technical report states clear price areas that will probably control the stock’s next move:
- Resistance: Nearby resistance is seen at $80.97, with a firmer zone between $82.29 and $83.34. A clear move above these levels, especially on high volume, would confirm the bullish breakout situation.
- Support: The primary support zone is wide and firm, from $76.16 to $79.34. A drop below this area, particularly on high volume, would cancel the current setup and point to a deeper pullback possibly starting.
Find Other Possible Breakout Setups
The review of Unum Group comes from a systematic screen for stocks showing both high technical and setup ratings. Investors looking to find other chances can run this screen each day to see a refreshed list of possible candidates. You can locate today’s technical breakout setups by going to the Technical Breakout Setups screen on ChartMill.
Disclaimer: This article is for information only and is not investment advice, a suggestion, or an offer to buy or sell any security. The technical analysis and automated trade ideas are from past data and statistical models, which are not certainties of future results. Always do your own research, think about your financial position and risk comfort, and talk with a qualified financial advisor before making any investment choices.