
UNUM GROUP (NYSE:UNM) has been identified as a Technical Breakout Setup Pattern by our stock screener. This pattern typically occurs when a stock takes a pause after a significant rise, indicating the possibility of a continuation in the trend. While it's impossible to predict with certainty, it might be beneficial to monitor NYSE:UNM.
Technical Analysis Observations
ChartMill assigns a Technical Rating to every stock. This score, ranging from 0 to 10, is updated daily and is determined by evaluating multiple technical indicators and properties.
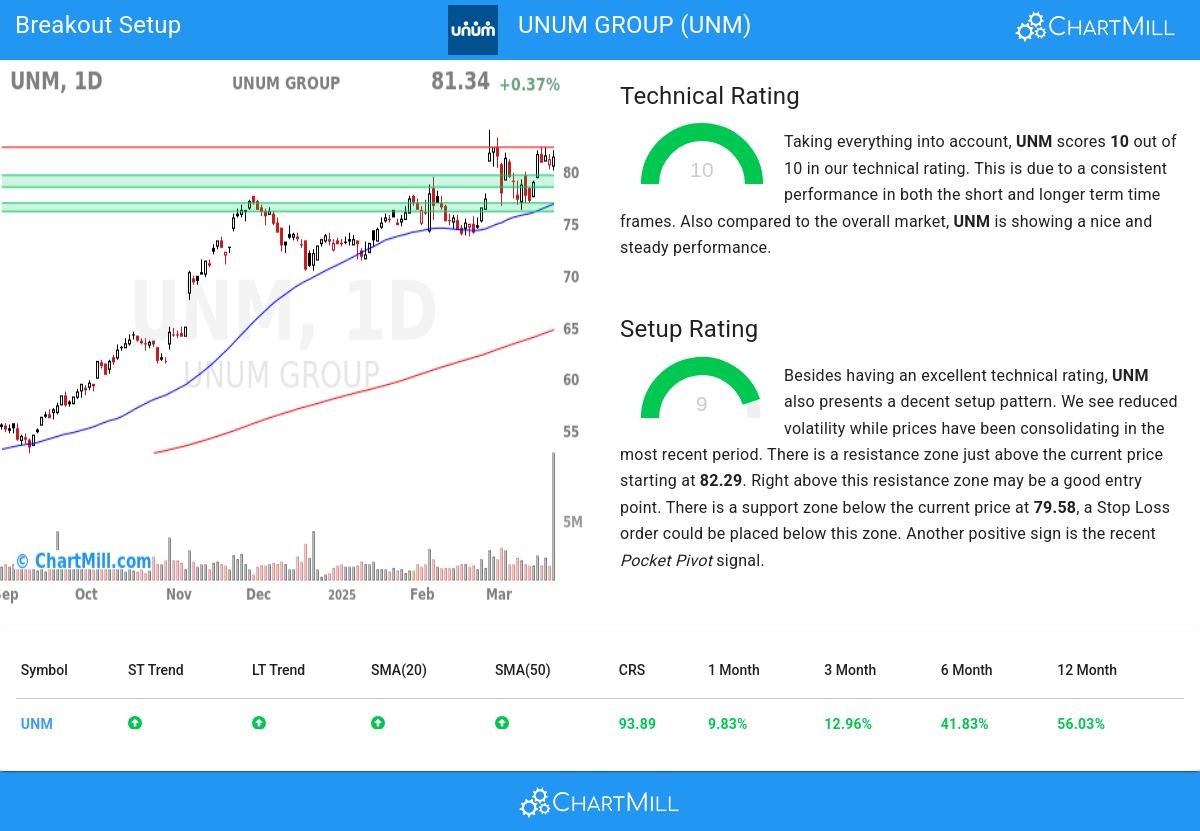
We assign a technical rating of 10 out of 10 to UNM. This is due to a consistent performance in both the short and longer term time frames. Also compared to the overall market, UNM is showing a nice and steady performance.
- Both the short term and long term trends are positive. This is a very positive sign.
- When comparing the yearly performance of all stocks, we notice that UNM is one of the better performing stocks in the market, outperforming 93% of all stocks. On top of that, UNM also shows a nice and consistent pattern of rising prices.
- UNM is one of the better performing stocks in the Insurance industry, it outperforms 93% of 143 stocks in the same industry.
- UNM is currently trading near its 52 week high. This is a good sign, certainly because the S&P500 Index is not trading near new highs.
- In the last month UNM has a been trading in the 74.38 - 83.96 range, which is quite wide. It is currently trading in the middle of this range, so some resistance may be found above.
- Volume is considerably higher in the last couple of days.
For an up to date full technical analysis you can check the technical report of UNM
How does the Setup look for UNM
Besides the Technical Rating, ChartMill also assign a Setup Rating to every stock. This setup score also ranges from 0 to 10 and determines to which extend the stock is consolidating. This is achieved by evaluating multiple short term technical indicators. UNM currently has a 9 as setup rating:
UNM has an excellent technical rating and also presents a decent setup pattern. Prices have been consolidating lately and the volatility has been reduced. There is a resistance zone just above the current price starting at 82.29. Right above this resistance zone may be a good entry point. There is a support zone below the current price at 79.58, a Stop Loss order could be placed below this zone. Very recently a Pocket Pivot signal was observed. This is another positive sign.
How to trade UNM?
For a potential trade one would typically wait until the stock breaks out of the consolidation zone to enter the stock and it could be sold again for a loss when it would fall back below the zone.
Of course, there are many ways to trade or not trade UNM and this article should in no way be interpreted as trading advice. The article is purely based on an automated technical analysis and just points out the technical observations. Always make your own analysis and trade at your own responsibility.
Our Breakout screener lists more breakout setups and is updated daily.
Keep in mind
This article should in no way be interpreted as advice. The article is based on the observed metrics at the time of writing, but you should always make your own analysis and trade or invest at your own responsibility.