
UGI CORP (NYSE:UGI) has been identified as a standout technical breakout candidate by our screening process. The stock combines strong technical health with a well-defined consolidation pattern, suggesting potential for further upside.
Technical Strength
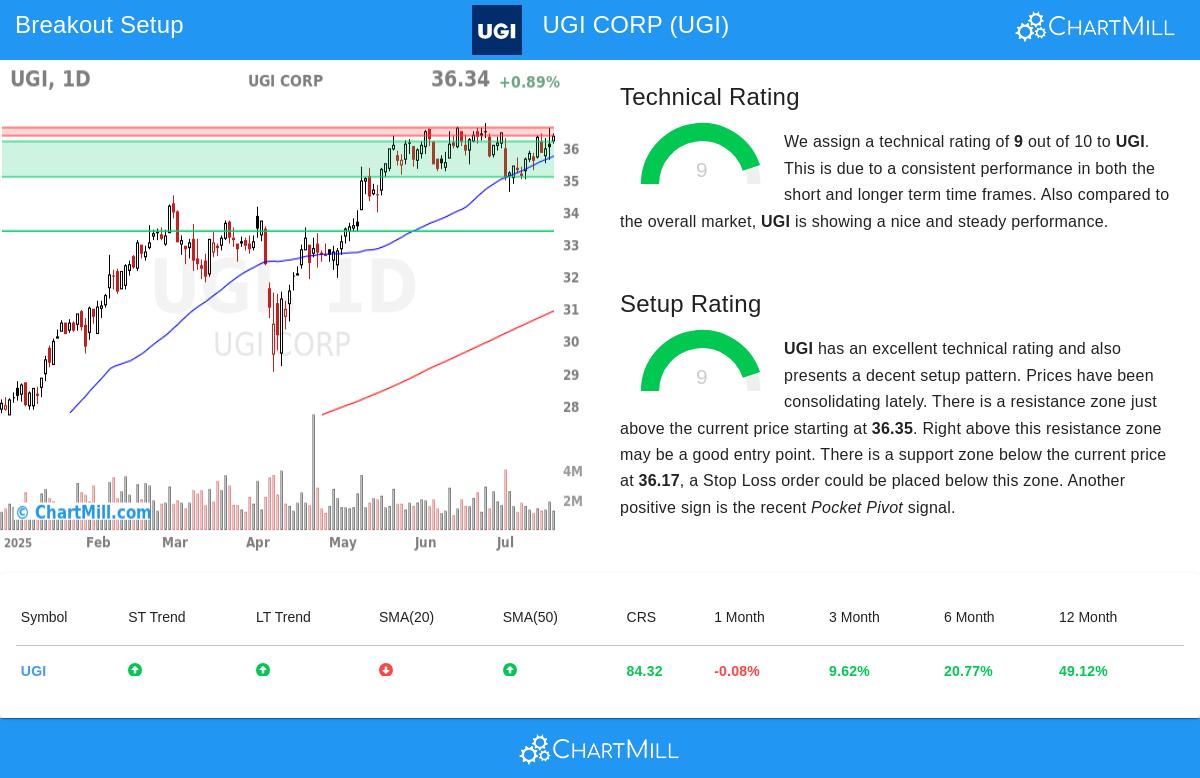
- High Technical Rating (9/10): UGI scores near the top of ChartMill’s technical rating system, reflecting consistent upward momentum in both short-term and long-term trends.
- Relative Strength: The stock has outperformed 84% of the market over the past year and ranks in the top 8% of its Gas Utilities industry group.
- Trend Confirmation: Both the 50-day and 200-day moving averages are rising, reinforcing the bullish trend.
- 52-Week High Proximity: UGI is trading close to its 52-week high of $36.74, indicating sustained buyer interest.
Setup Quality
- Tight Consolidation: Prices have been range-bound between $34.61 and $36.74 over the past month, forming a clear base.
- Support and Resistance: A key resistance zone sits just above the current price at $36.35-$36.60, while support is established near $36.17. A breakout above resistance could signal further gains.
- Pocket Pivot Signal: Recent volume patterns suggest accumulation, adding confidence to the setup.
- Low-Risk Entry: The suggested entry at $36.61 (above resistance) with a stop at $35.06 limits downside risk to ~4.2%.
For a deeper look at the technicals, review the full ChartMill technical report.
Our Technical Breakout Screener updates daily with new potential breakout candidates.
Disclaimer
This is not investment advice. Always conduct your own analysis and consider risk management before trading.