
TEXAS INSTRUMENTS INC (NASDAQ:TXN) is a hidden gem unveiled by our stock screening tool, featuring a promising dividend outlook alongside solid fundamentals. TXN demonstrates decent financial health and profitability while ensuring a sustainable dividend. Let's break it down further.
Assessing Dividend Metrics for TXN
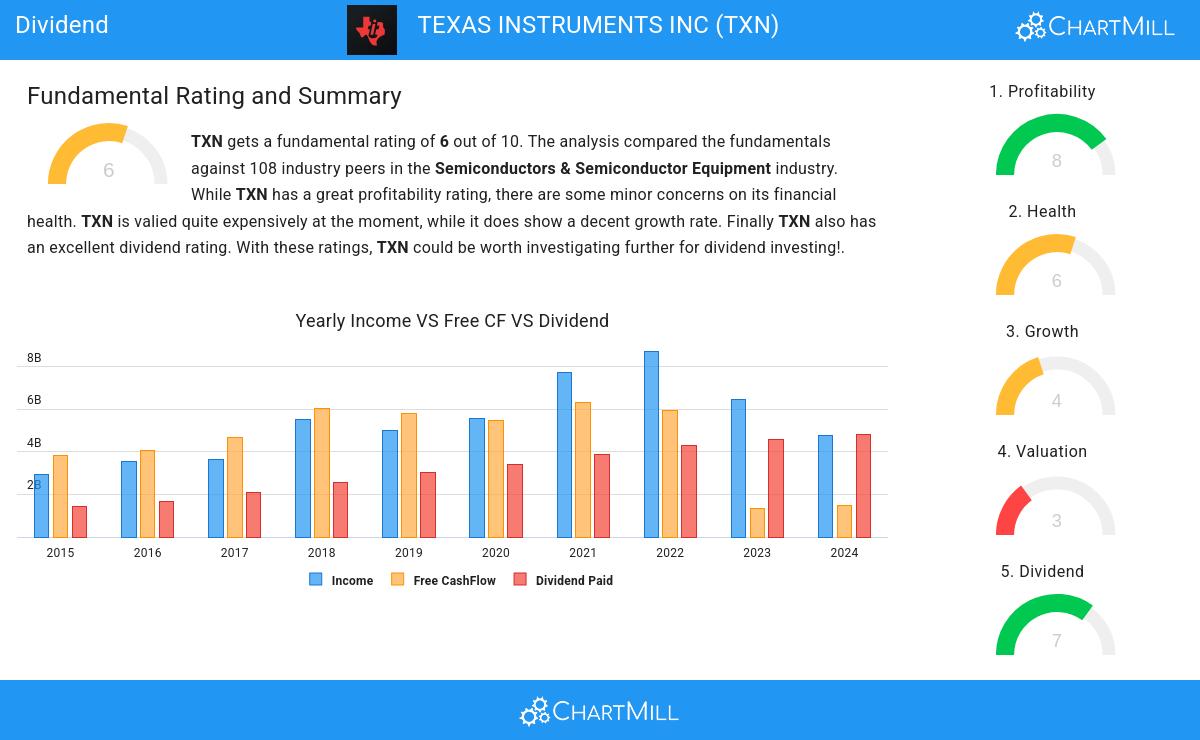
ChartMill provides a Dividend Rating for every stock, ranging from 0 to 10. This rating assesses various dividend aspects, including yield, growth, and sustainability. TXN earns a 7 out of 10:
- TXN's Dividend Yield is rather good when compared to the industry average which is at 2.35. TXN pays more dividend than 91.67% of the companies in the same industry.
- Compared to an average S&P500 Dividend Yield of 2.34, TXN pays a bit more dividend than the S&P500 average.
- On average, the dividend of TXN grows each year by 10.46%, which is quite nice.
- TXN has paid a dividend for at least 10 years, which is a reliable track record.
- TXN has not decreased their dividend for at least 10 years, which is a reliable track record.
- TXN's earnings are growing more than its dividend. This makes the dividend growth sustainable.
Deciphering TXN's Health Rating
To gauge a stock's financial health, ChartMill utilizes a Health Rating on a scale of 0 to 10. This comprehensive evaluation encompasses liquidity and solvency, both in absolute terms and in comparison to industry peers. TXN has earned a 6 out of 10:
- TXN has an Altman-Z score of 8.48. This indicates that TXN is financially healthy and has little risk of bankruptcy at the moment.
- The Altman-Z score of TXN (8.48) is better than 76.85% of its industry peers.
- A Current Ratio of 4.12 indicates that TXN has no problem at all paying its short term obligations.
- TXN has a Current ratio of 4.12. This is in the better half of the industry: TXN outperforms 67.59% of its industry peers.
- TXN has a Quick Ratio of 2.88. This indicates that TXN is financially healthy and has no problem in meeting its short term obligations.
- With a decent Quick ratio value of 2.88, TXN is doing good in the industry, outperforming 61.11% of the companies in the same industry.
Understanding TXN's Profitability
ChartMill employs its own Profitability Rating system for stock evaluation. This score, ranging from 0 to 10, is derived from an analysis of diverse profitability metrics and margins. In the case of TXN, the assigned 8 is noteworthy for profitability:
- With an excellent Return On Assets value of 13.44%, TXN belongs to the best of the industry, outperforming 84.26% of the companies in the same industry.
- TXN has a better Return On Equity (28.24%) than 89.81% of its industry peers.
- TXN has a Return On Invested Capital of 14.73%. This is amongst the best in the industry. TXN outperforms 87.96% of its industry peers.
- TXN had an Average Return On Invested Capital over the past 3 years of 24.88%. This is significantly above the industry average of 11.35%.
- The last Return On Invested Capital (14.73%) for TXN is well below the 3 year average (24.88%), which needs to be investigated, but indicates that TXN had better years and this may not be a problem.
- The Profit Margin of TXN (30.52%) is better than 91.67% of its industry peers.
- Looking at the Operating Margin, with a value of 34.15%, TXN belongs to the top of the industry, outperforming 94.44% of the companies in the same industry.
- TXN has a Gross Margin of 58.14%. This is amongst the best in the industry. TXN outperforms 83.33% of its industry peers.
More Best Dividend stocks can be found in our Best Dividend screener.
Our latest full fundamental report of TXN contains the most current fundamental analsysis.
Disclaimer
This article should in no way be interpreted as advice. The article is based on the observed metrics at the time of writing, but you should always make your own analysis and trade or invest at your own responsibility.